


پرائس ایکشن ٹریڈنگ کے فوائد اور نقصانات
پرائس ایکشن ٹریڈنگ کے چارٹ پیٹرنز
پرائس ایکشن پر کیسے ٹریڈنگ کی جائے
2008 میں، عالمی مالیاتی منڈیوں نے دہائیوں میں بدترین سالوں میں سے ایک کا تجربہ کیا۔ S&P 500، DAX اور Nikkei نے عالمی مالیاتی بحران کے دوران بالترتیب 40%, 41%, اور 40% سے زیادہ کی کمی کی، جس کا سبب مالیاتی صنعت کی غیر ریگولیٹری تھا۔ اس غیر ریگولیشن نے بنکوں کے خطرات لینے میں اضافہ اور لیہمن برادرز اور بیئر سٹرنز جیسے وال اسٹریٹ کی ممتاز فرموں کے خاتمے کا سبب بنایا۔ بحران ختم ہونے کے بعد، S&P, DAX, Nikkei اور ڈاؤ جونز انڈسٹریل ایوریج (DJIA) نے بالترتیب 256%, 200%, 174%, اور 235% اضافہ کیا۔ وہ سرمایہ کار جنہوں نے بحران سے پہلے اسٹاک میں سرمایہ کاری کی، ان کی سرمایہ کاری دگنی سے زائد ہوگئی ہے، جو مارکیٹ میں رجحان کو آپ کا دوست بنانے کی عمدہ مثال ہے۔ پرائس ایکشن ٹریڈنگ میں ممکنہ حد تک جلدی رجحانات کی شناخت کرنا اور مواقع کی تلاش کرنا شامل ہے۔ تکنیکی تجزیہ ضروری ہے کیونکہ ٹریڈرز یقین رکھتے ہیں کہ سابقہ ٹریڈنگ پیٹرنز مستقبل کی حرکات کو ظاہر کر سکتے ہیں۔
پرائس ایکشن ٹریڈنگ (P.A.T.) ایک ٹریڈنگ تکنیک ہے جو 'ننگے' پرائس چارٹ پر مبنی فیصلے لینے میں شامل ہے۔ پرائس ایکشن کا مطلب ہے کہ ٹریڈرز پیچھے رہنے والے انڈیکیٹرز استعمال نہیں کرتے ہیں۔ تاہم، کچھ ٹریڈرز متحرک سپورٹ اور ریزسٹنس کی شناخت کے لئے کچھ چلتی اوسط استعمال کرسکتے ہیں یا رجحان کو پڑھنے کے لئے استعمال کرسکتے ہیں؛ اس لئے PA مکمل طور پر پرائس پر مرکوز ہوتا ہے۔ اگرچہ مختلف اقتصادی خبریں پرائس کی نقل و حرکت کا محرکہ بناتی ہیں، ٹریڈرز کو ٹریڈنگ کے فیصلے کرنے کے لئے اس کا تجزیہ کرنے کی ضرورت نہیں ہے۔ اس کی وجہ یہ ہے کہ تمام خبریں جو مارکیٹ وولیٹیلیٹی کا باعث بنتی ہیں، بغیر انڈیکیٹرز کے، 'ننگے' پرائس چارٹ پر PA کے ذریعے ان کی عکاسی ہوتی ہے۔پرائس ایکشن کیا ہے؟
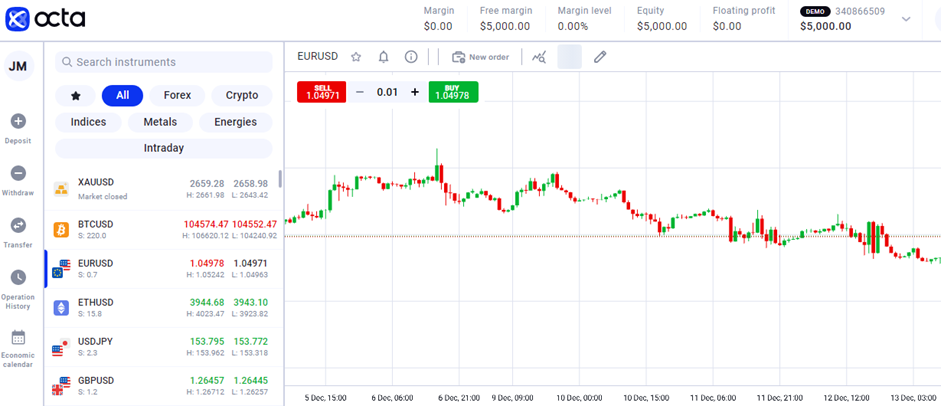
EURUSD 'ننگا' پرائس چارٹ
چونکہ پرائس ایکشن تمام تغیرات کی عکاسی کرتا ہے جو کسی بھی وقت مارکیٹ پرائس کو چلاتی ہیں، اسٹاکسٹک یا RSI جیسے انڈیکیٹرز کا استعمال ضروری نہیں ہے۔
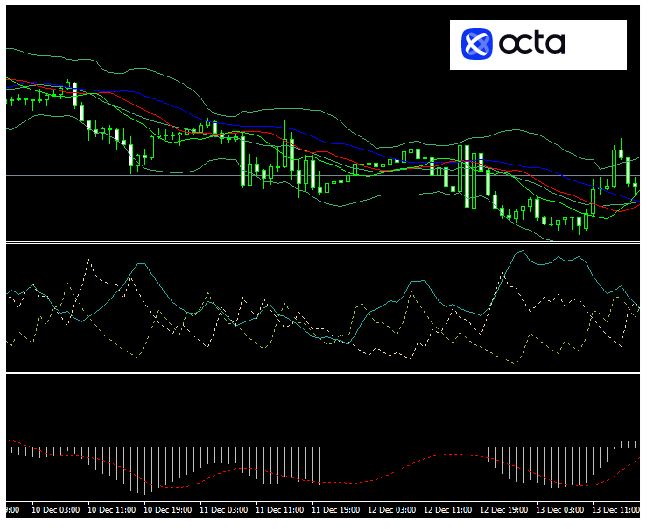
EURUSD 'بےترتیب' پرائس چارٹ
ہمارا آرٹیکل'تکنیکی تجزیہ' فاریکس ٹریڈنگ کے شرائط کے بارے میں مزید معلومات پر مشتمل ہے۔
پرائس ایکشن حکمت عملی کا بغور تجزیہ کرتے ہوئے، اس کے فوائد اور نقصانات کا تجزیہ کرنا ضروری ہے۔ آئیں فاریکس ٹریڈنگ میں پرائس ایکشن کے خصوصی پہلوؤں کا جائزہ لیتے ہیں جو توجہ کے لائق ہیں۔ تاہم، پرائس ایکشن ٹریڈنگ کے ساتھ کچھ نقصانات بھی ہوتے ہیں:پرائس ایکشن ٹریڈنگ کے فوائد اور نقصانات
کنٹینیشن پیٹرنز وہ شکلیں ہوتی ہیں جو کسی قیمت کے چارٹ پر ظاہر ہوتی ہیں جب قیمت کسی خاص سمت میں پہلے ہی حرکت کر رہی ہوتی ہے، جیسے اوپر یا نیچے جانا۔ مثال کے طور پر، اگر قیمت بڑھ رہی ہے اور آپ کو ایک مثلث کی شکل بنتے دکھائی دیتی ہے، تو یہ عموماً قیمت کے آگے بڑھنے کی نشاندہی کرتی ہے۔ ٹریڈرز خریداری یا فروخت کا فیصلہ کرنے سے پہلے ان پیٹرنز کی تلاش کرتے ہیں تاکہ تصدیق ہو سکے کہ رجحان جاری رہے گا۔ پرائس ایکشن ریورسلز اہم قوانین کی خلاف ورزیوں کے وقت رجحان میں ممکنہ تبدیلی کی نشاندہی کرتے ہیں۔ مثال کے طور پر، کسی اوپر جاتے رجحان میں جہاں قیمتیں بڑھتی رہتی ہیں، اگر قیمت پچھلے لو سے نیچے گرتی ہے، تو یہ اشارہ ہوسکتا ہے کہ رجحان کمزور ہو رہا ہے۔ اگر اس کمی کے بعد ایک اور نچلی ہائی آتی ہے تو ریورسل کی یاد دلائی جا سکتی ہے۔ تاہم، اس کا ہمیشہ مطلب نہیں ہوتا کہ رجحان ختم ہو گیا ہے؛ حالات تیزی سے تبدیل ہو سکتے ہیں۔پرائس ایکشن ٹریڈنگ پیٹرنز
Candlestick patterns can take many forms, but let's consider the most common ones and highlight how they differ from each other. An Inside Bar has two bars (or candles). The smaller bar is entirely within the range of a larger bar, called the 'mother bar'. Inside bars usually happen when the market is stable, but they can sometimes trick traders into thinking a trend is changing. Skilled traders look at the size and position of the Inside Bar to decide whether it means the market is calm or a trend change is coming.Chart patterns for price action trading
Inside and Outside Bars
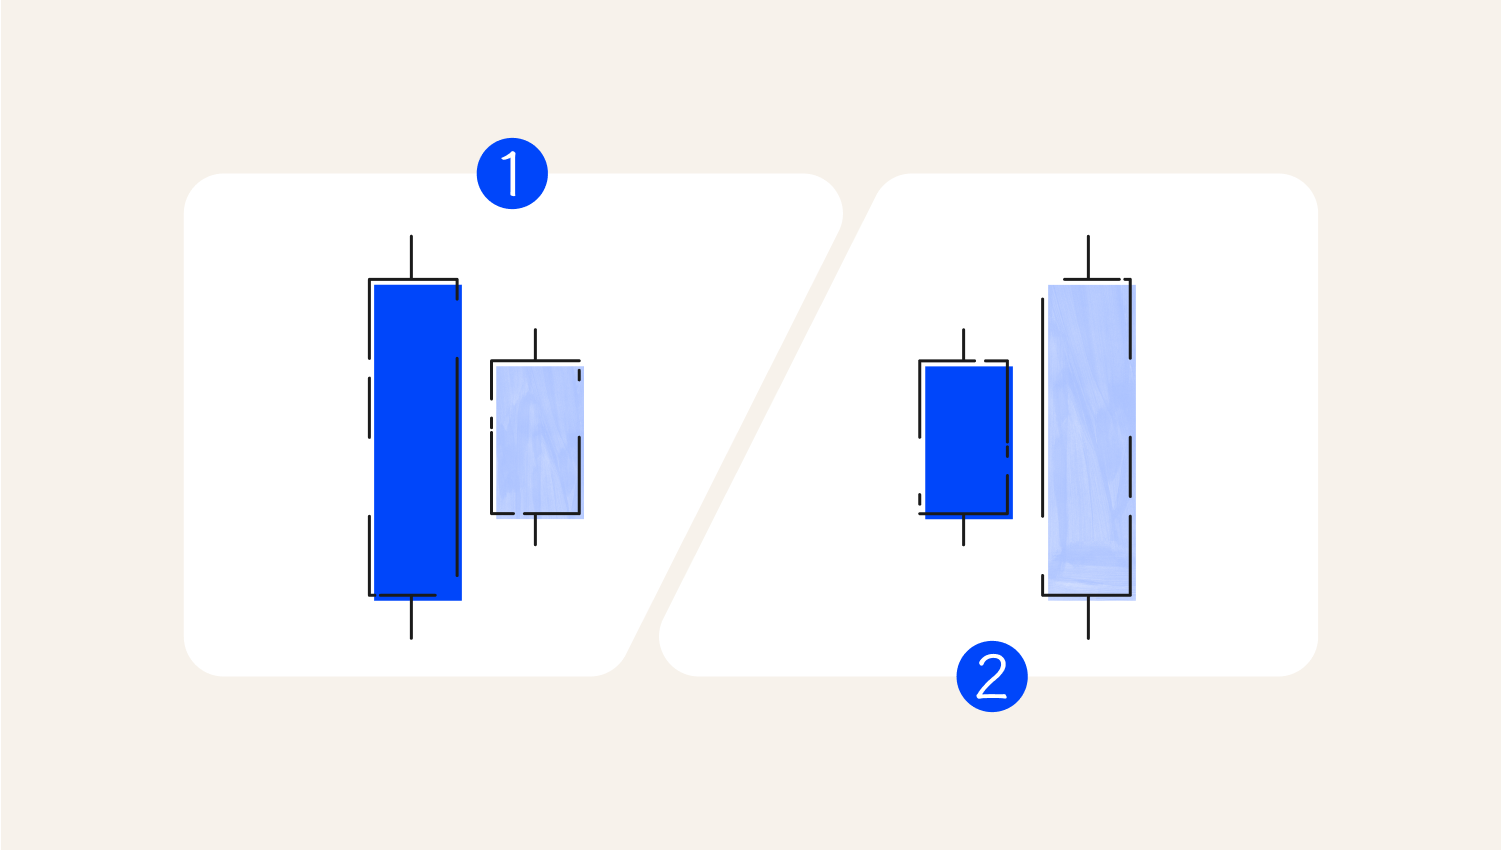
1. Inside Bar
2. Outside Bar
An Outside Bar is a candlestick pattern in which the current candle's range (high and low) is larger than the previous candle's range, indicating potential reversal or increased volatility in the market.
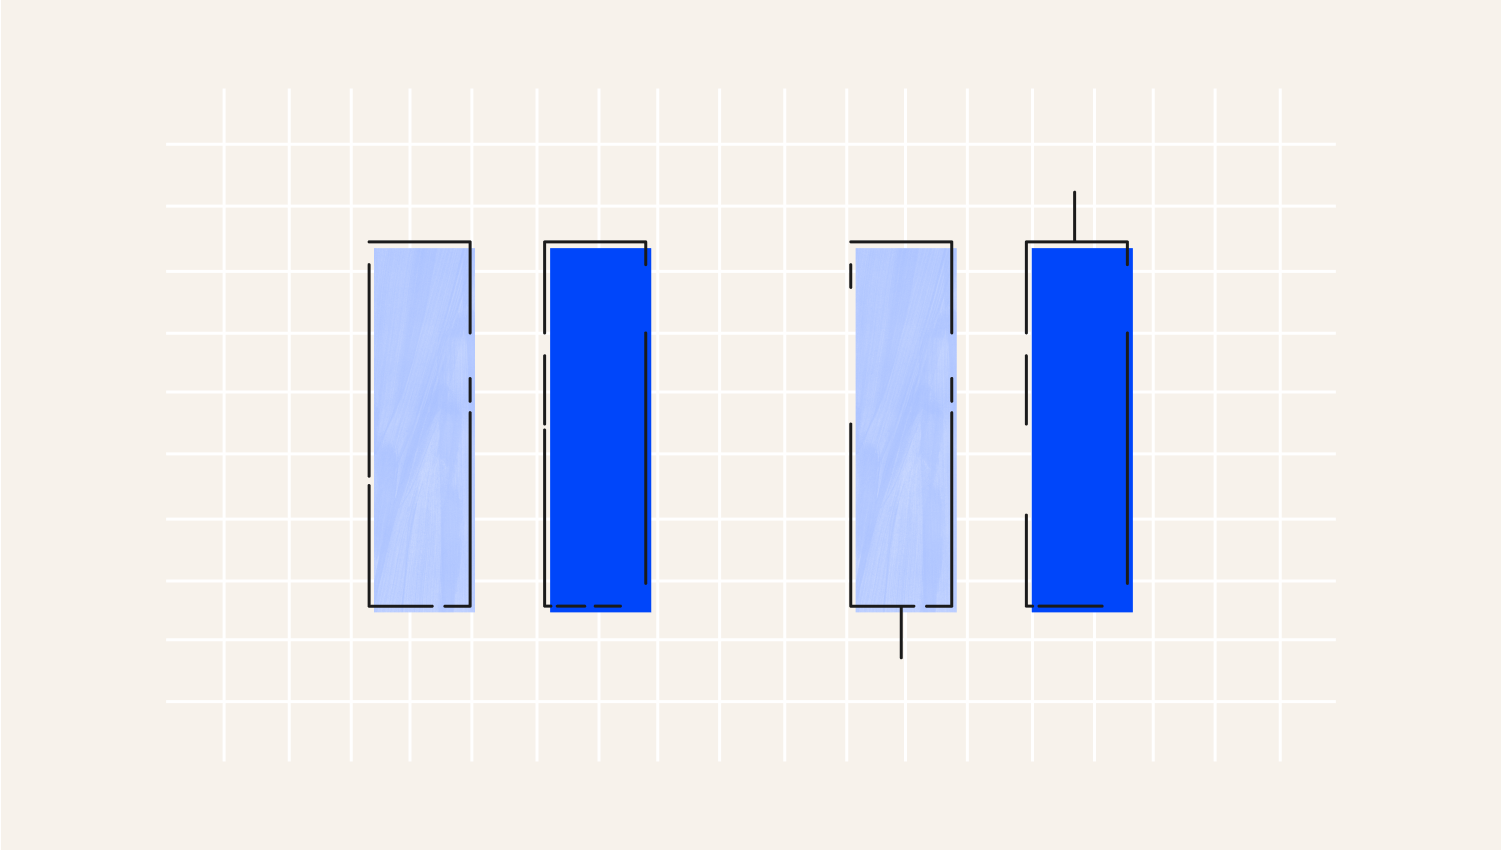
Marubozu Bars
The Marubozu is a unique candlestick pattern in Price Action, characterised by its singular structure and absence of shadows, which convey strong market sentiment. The term 'Marubozu', derived from Japanese, translates to 'bald' or 'shorn', aptly describing its appearance—this candlestick appears as if its tails have been 'trimmed', resulting in a clean, uninterrupted body.
Pin Bars
Pin Bars have long wicks, suggesting pressure from buyers or sellers to push prices in the opposite direction. The wick shows prices that were pushed away. For example, if a pin bar has a long wick at the bottom, lower prices are rejected, hinting that prices might increase.
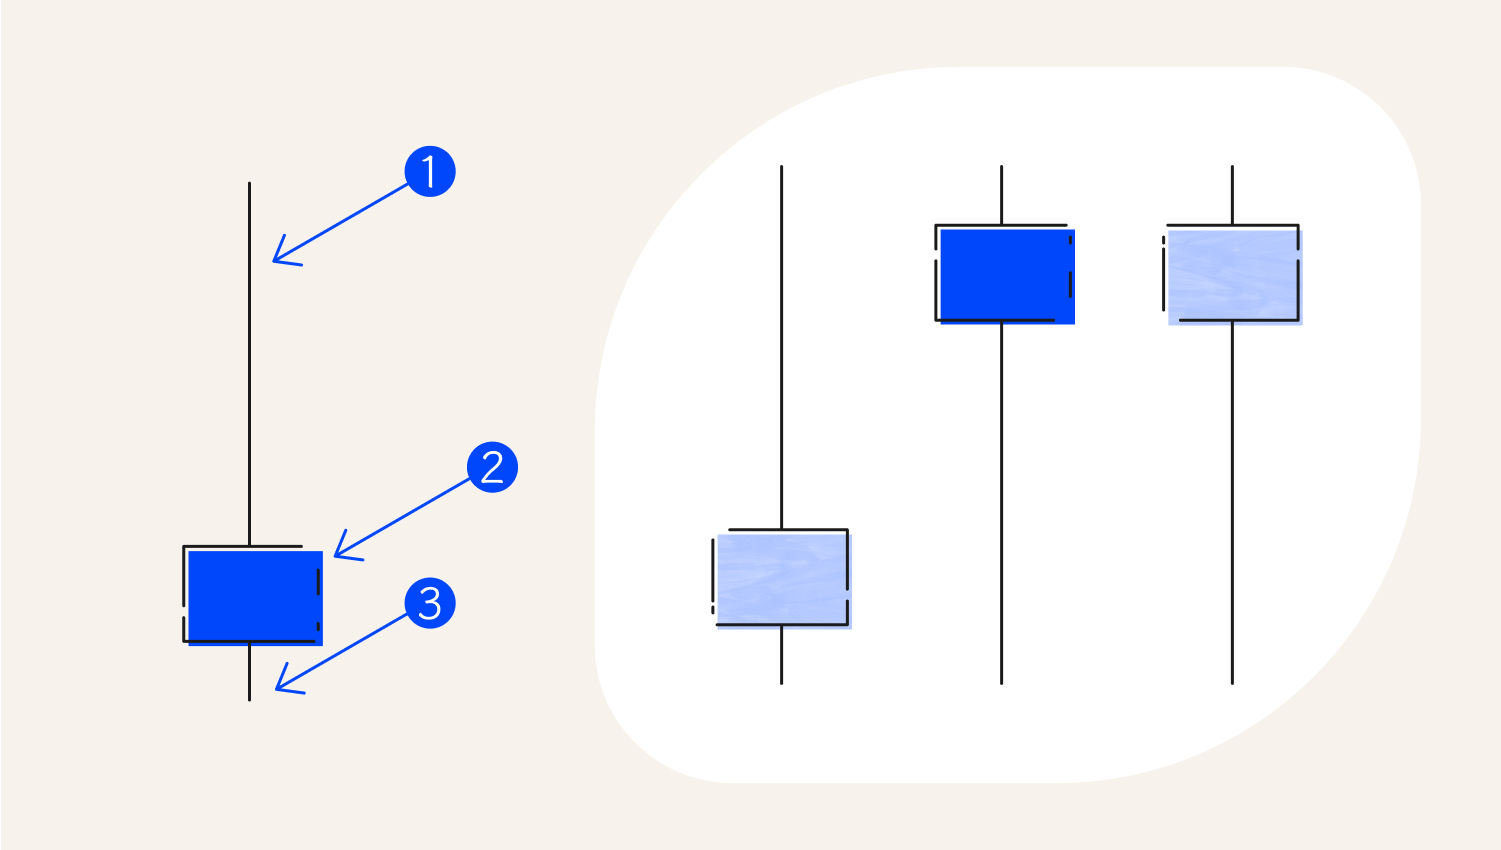
1. Long wick
2. Small body
3. Short wick
One aspect of trading using the PA is trend identification. Trading with the trend, or simply put, 'trend following', is the highest-probability way to trade any market. The charts below show how to use price action to identify the trend. In a bullish market, the price makes higher highs and higher lows (HH, HL), while in a bearish market, the price makes Lower Highs and Lower Lows (LH, LL).How to identify a trend
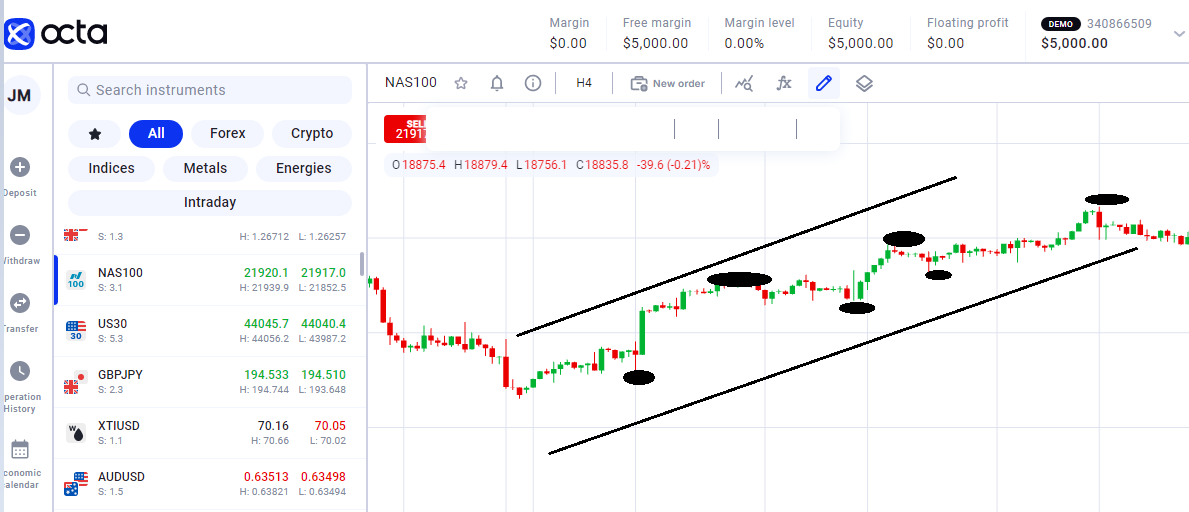
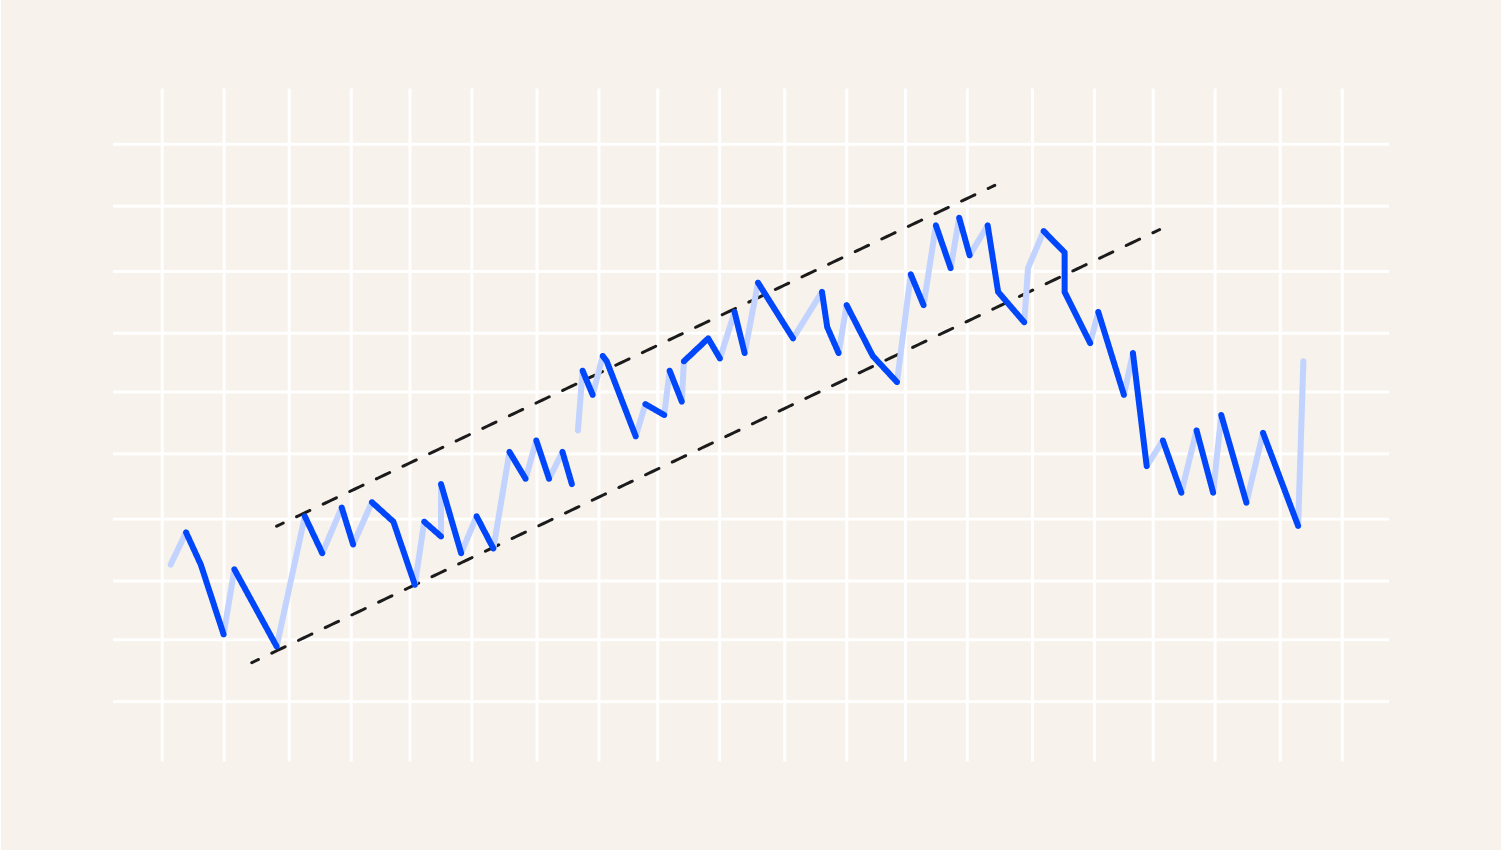
Below are a few price action trading strategies. The Trend Line Strategy relies on drawing trend lines—imaginary lines that help traders identify areas where the price might change direction. These lines serve as support and resistance levels. To draw a trend line, connect at least two consecutive points: two higher lows for an upward trend or two lower highs for a downward trend, creating a boundary that indicates the trend's direction. In trading, if the price approaches the trend line, it can signal a potential buying or selling opportunity. For a buy trade, traders place an order slightly above the highest price of the candle that touched the trend line, with a stop loss set below it. Conversely, for a sell trade, the order is placed below the lowest price of the candle that touched the trend line. It is also essential to look for specific candlestick patterns that indicate possible reversals, as they can confirm whether the price will bounce off or break through the trend line.How to trade on price action
Trend Lines Strategy
While this strategy can be effective, traders should be prepared for situations where the price breaks through the trend line, as other methods may be needed.
Support and Resistance Strategy
This method is used to identify key price levels where the market tends to reverse. These levels are determined by observing charts and noting where prices hit their highest and lowest points.
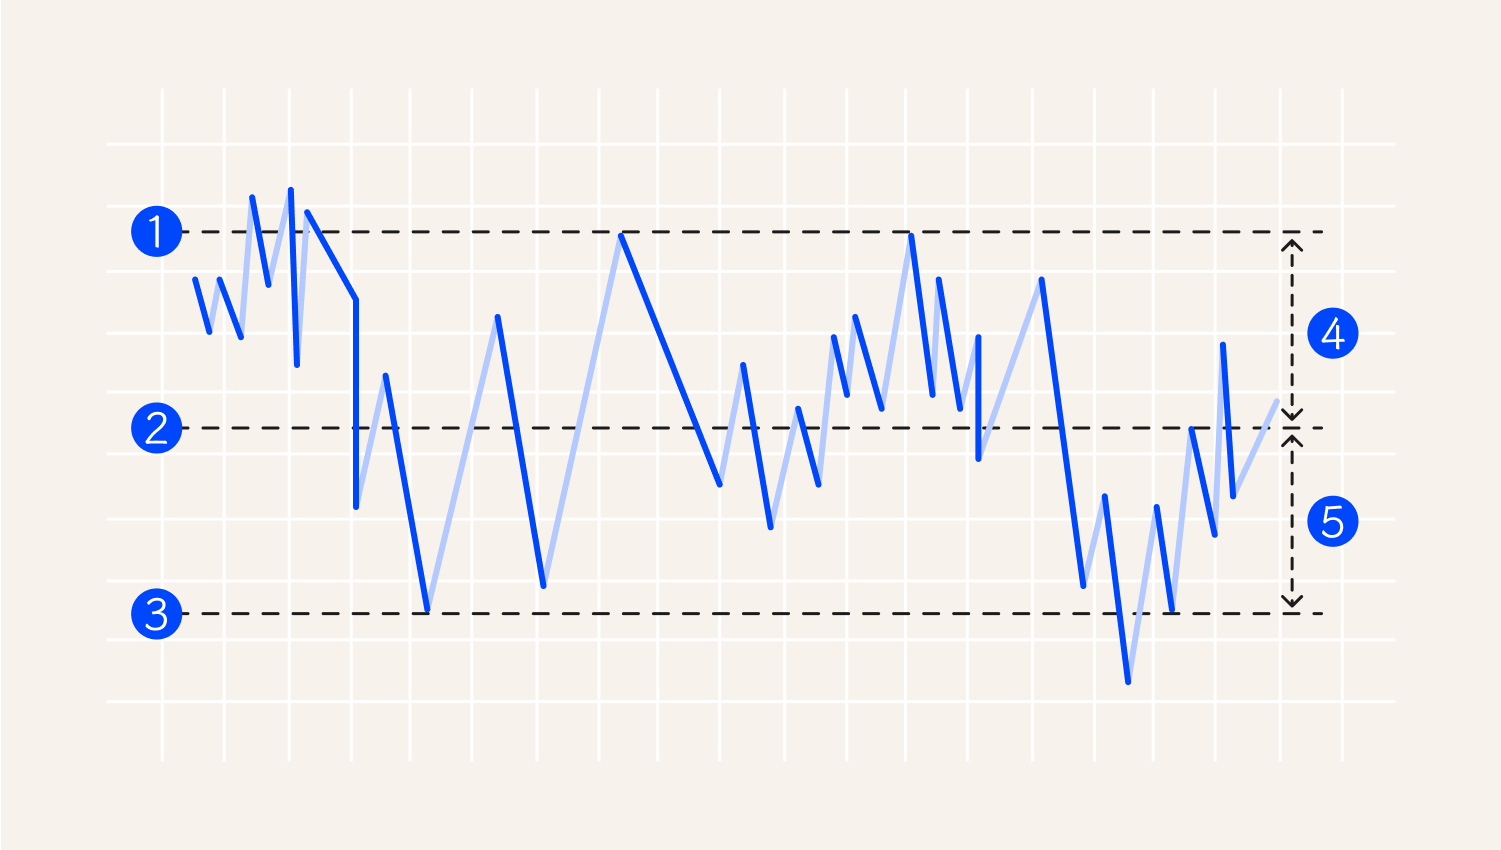
1. Stop loss
2. Entry
3. Profit target
4. Risk
5. Reward
When trading, if the price bounces off the resistance level (the top line), it may then reach the support level (the bottom line). Traders can buy when the price hits support or sell when it touches resistance. Stop-loss orders protect against losses, while take-profit orders secure gains. It's crucial to adjust these levels based on the trading timeframe and be aware of patterns pinpointing potential reversals.
Shooting Star Strategy
It is one of the price action trading strategies that might be applied with any currency pair and timeframe. A Shooting Star candle looks like an upside-down Hammer. It indicates a potential price drop. It forms when buyers push the price up, but sellers take over, leading to a reversal.
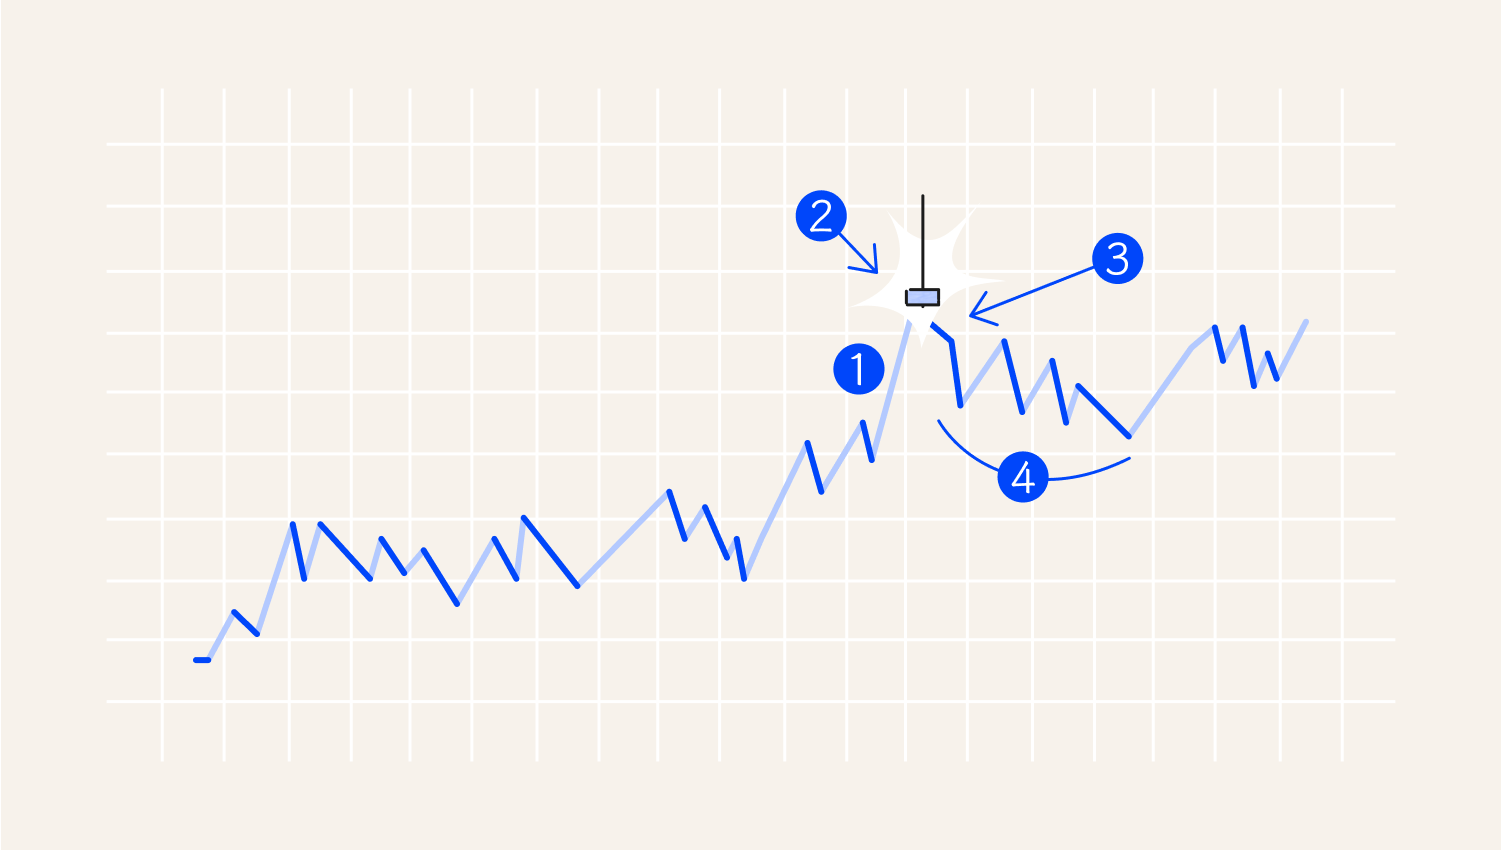
1. Rising price
2. Shooting Star
3. Price drop confirmation
4. Declining price
In this strategy, traders focus on selling rather than buying. To sell, wait for the price to close below the Shooting Star's low point. Set a stop loss above the candle's high and aim for profit at support levels. This strategy requires careful observation of price movements after the Shooting Star, which can indicate quick trading opportunities.
The timeframe of the chart is crucial when using the price action strategy. Securities charts differ between different timeframes. For example, a security might have a strong upward trend on a daily chart and a strong downward trend on an hourly chart. One way to avoid a mistake is to consider the type of trader you are. If you are a scalper who benefits from tiny movements, you should use a chart that ranges from 5 minutes to 15 minutes. If you are a day trader who holds trades for a day, your charts should range from 30 minutes to 4 hours. If you are a swing trader who holds a trade for a few days, your charts should range from 1 hour to daily, while if you are a long-term trader, you should focus on daily, weekly, and monthly charts.Caution
Investors who bought stocks at the end of the financial crisis have made money by timing it right. Equally, traders who bought cryptocurrencies in 2017 and shorted them in 2018 have made good money. These examples show the power of price action
in the financial markets. To succeed in it, however, you need to take time to learn and practice using a demo account from your broker.Summary
