WTI bears are pressuring the bulls below critical resistance, break of $84.70 on the cards
- WTI has been in the hands of the bears mid-week.
- A bearish H&S pattern has emerged on the daily chart with the right-hand shoulder on the backside of the micro trendline.
West Texas Intermediate (WTI) is around flat on the day so far following a consolidative and inside day on Wednesday. NATO said there was no evidence a missile that landed near a Polish village and killed two was a deliberate attack. The consensus is that it likely came from a Ukrainian air-defense system firing during Russian attacks and this has been easing concerns of an expanding war.
The Druzhba pipeline, which carries Russian oil into Europe was shut down earlier this week after Russian artillery damaged its infrastructure. However, the power supply is said to have been restored, analysts at ANZ Bank said. This is allowing oil delivers to countries such as Hungary, the Czech Republic, and Slovakia. ''Initial concerns of further disruptions in the Middle East also eased. An oil tanker was hit by a projectile in the Gulf of Oman, although damage was limited.''
Nevertheless, the analysts at ANZ Bank also said that the market is still facing supply-side issues. ''Germany warned it can’t rule out temporary supply bottlenecks when a ban on imports on Russian crude starts next month. OPEC also appears to be reducing output in line with its agreement to cut production. Tanker tracker data shows that OPEC shipments were significantly more than 1mb/d in the first 15 days of November, according to Petro-Logistics. Markets found some support from EIA’s weekly inventory report. Commercial stockpiles reached 5,400kbbl last week.''
WTI technical analysis
The following illustrates a multi-time-frame bearish bias on the monthly, weekly, and daily charts.
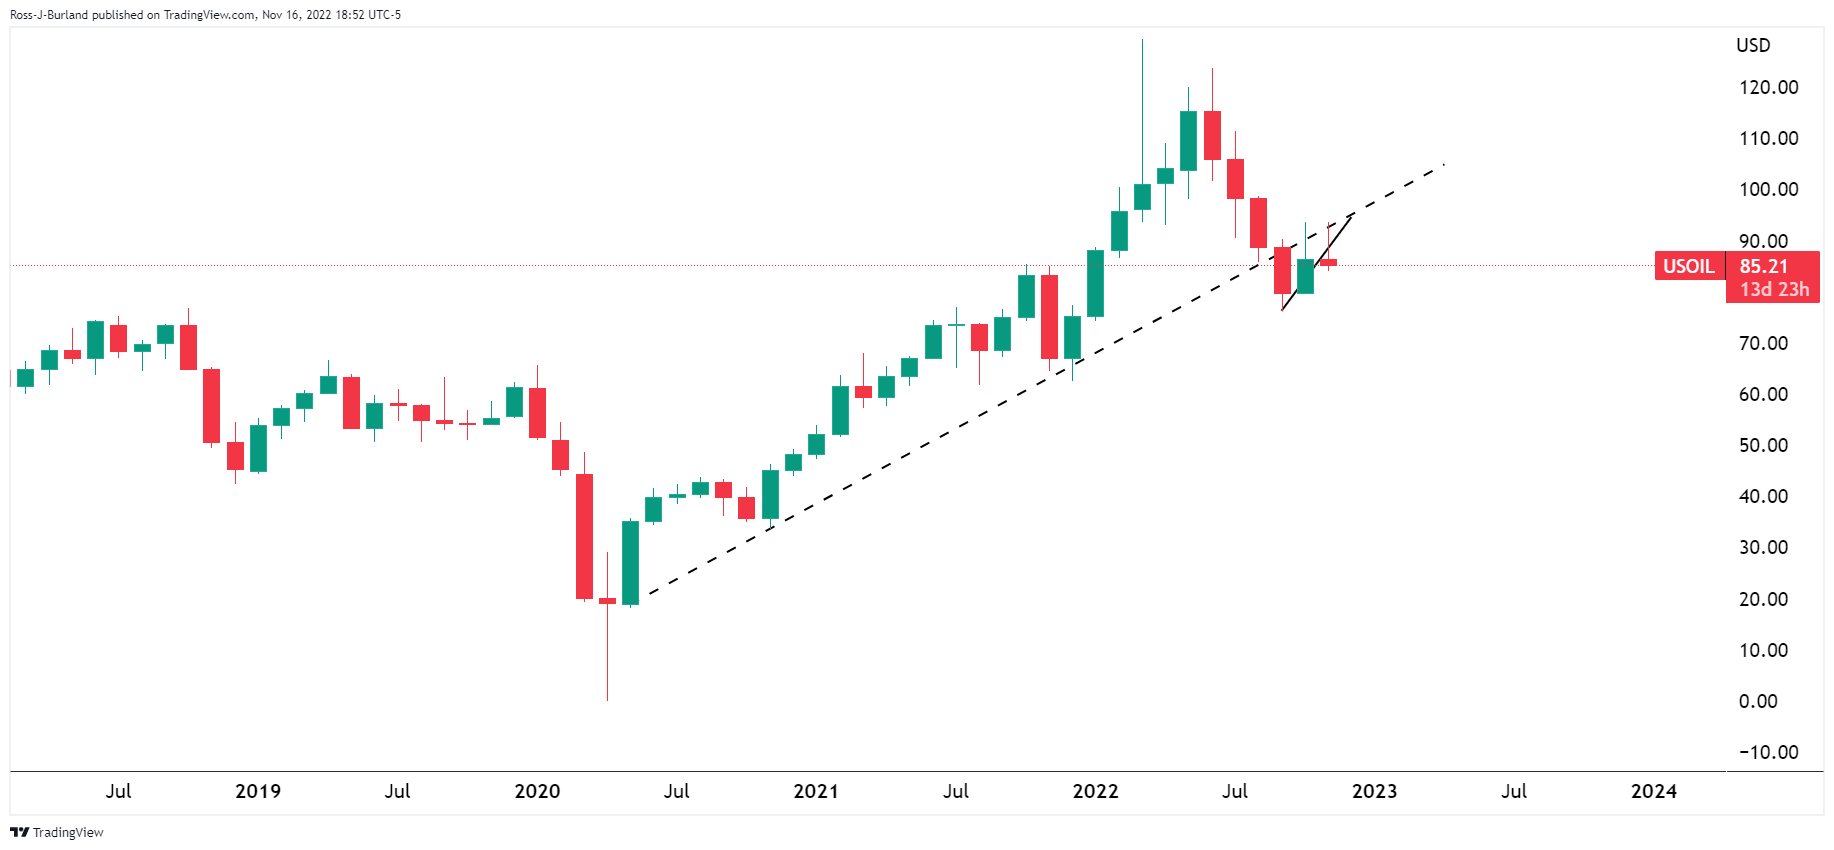
The price is now on the back side of the monthly trendline and is being rejected on a restest.
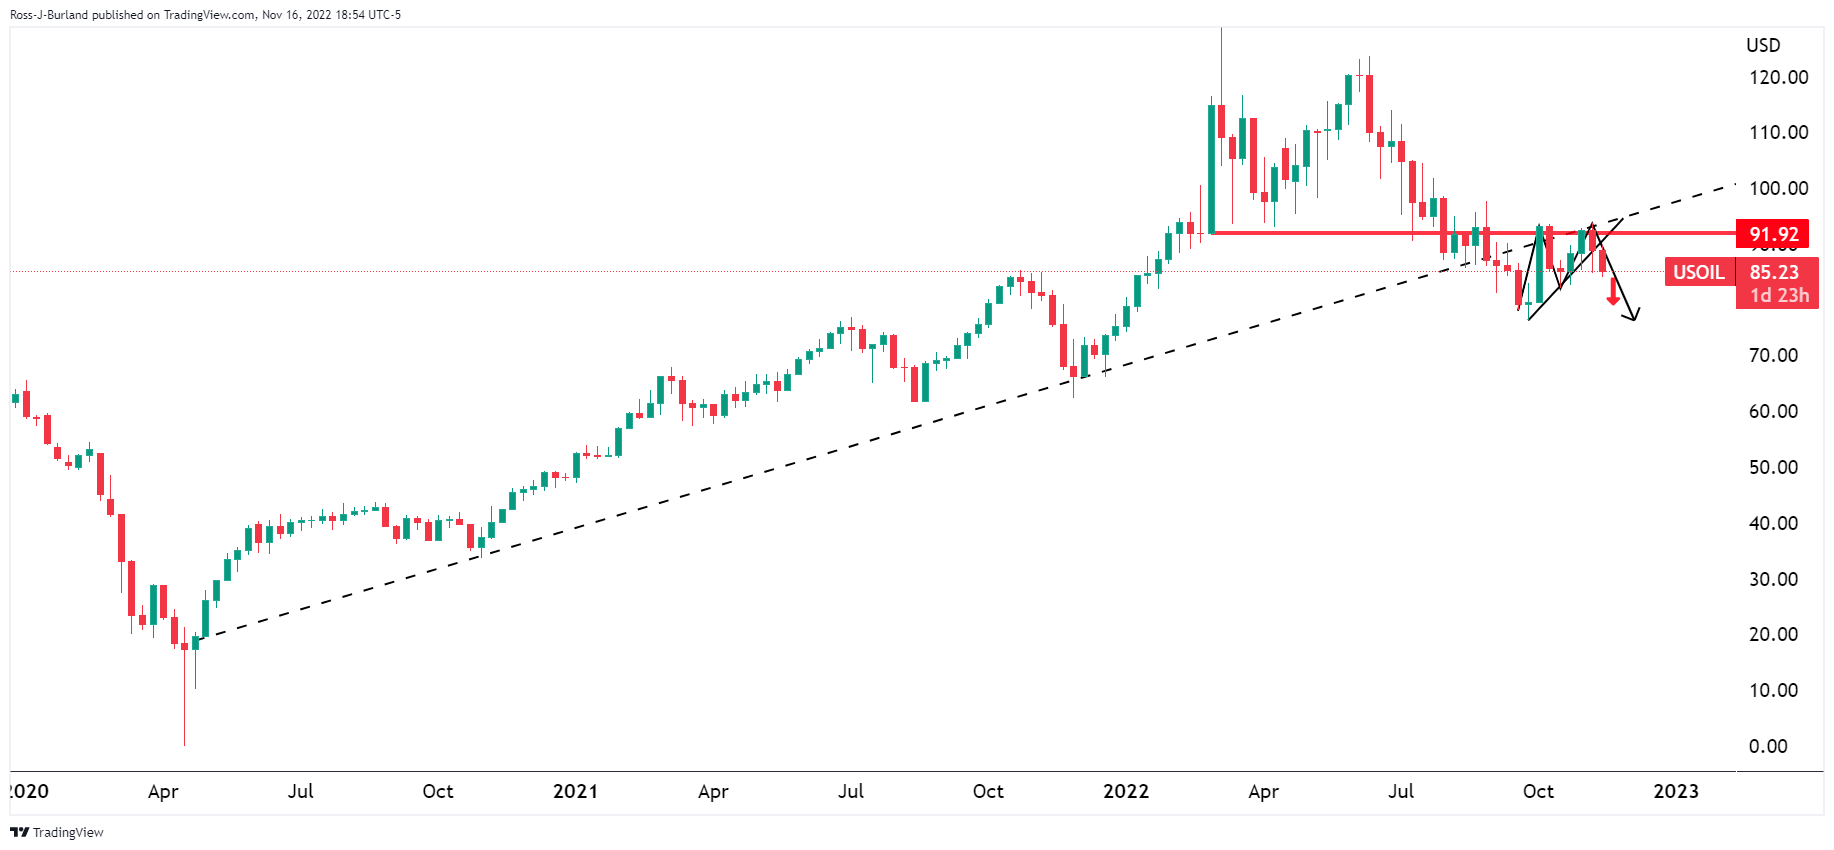
The price could be on the verge of completing an M-formation below the locked-in highs below horizontal resistance.
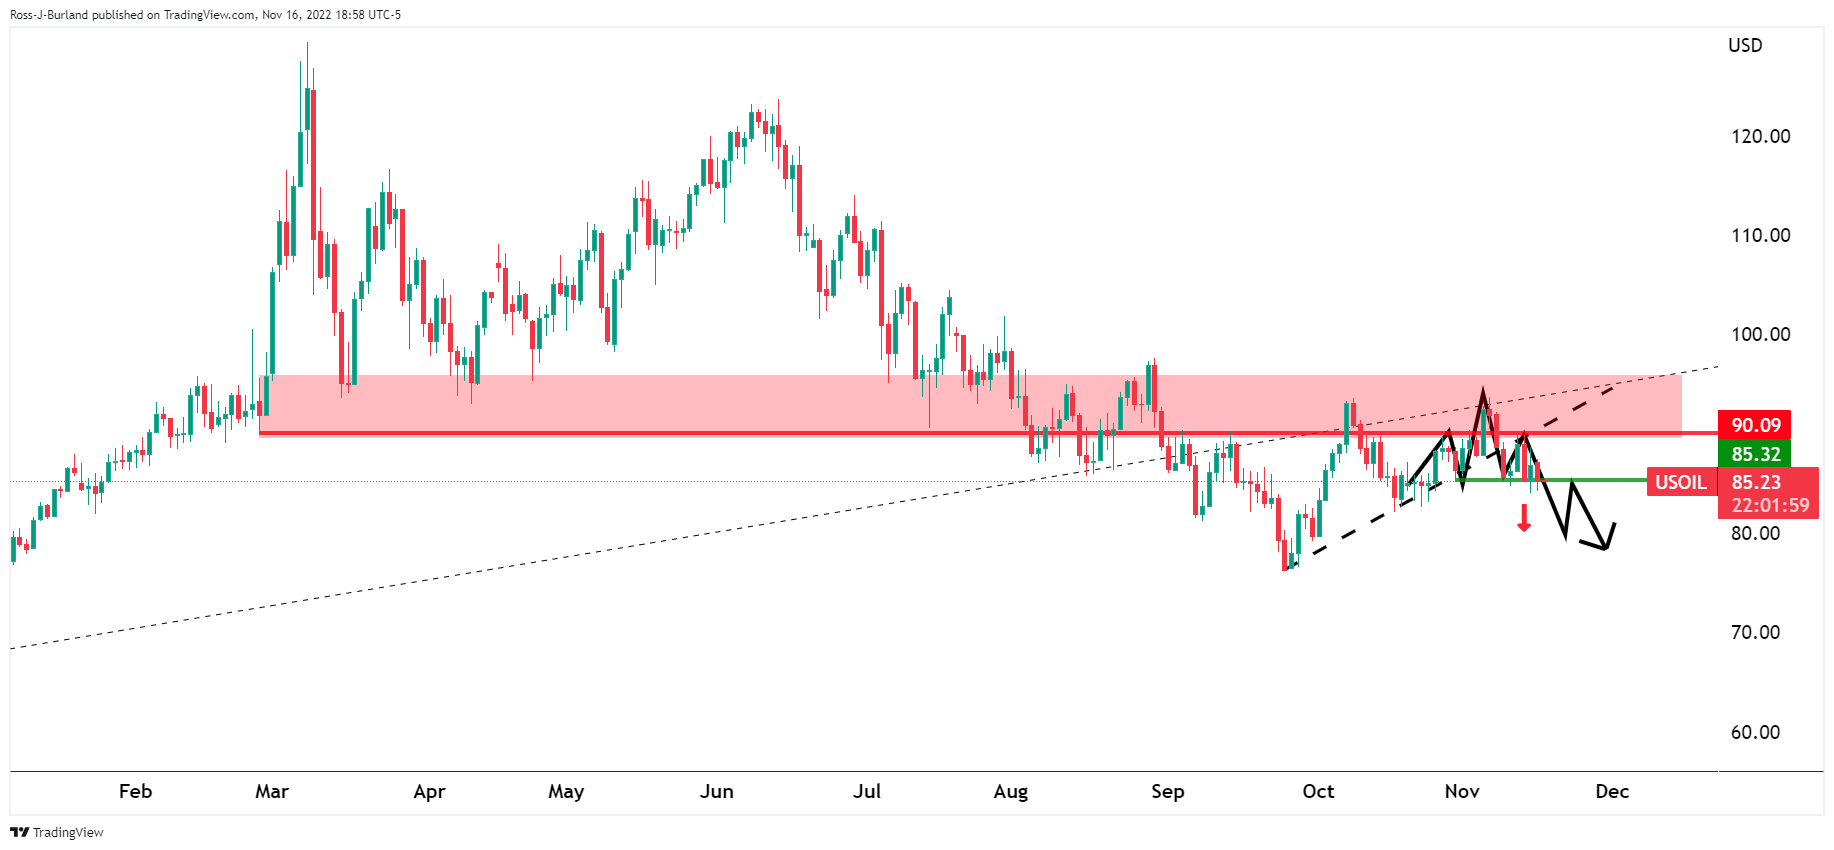
A bearish H&S pattern has emerged on the daily chart with the right-hand shoulder on the backside of the micro trendline.
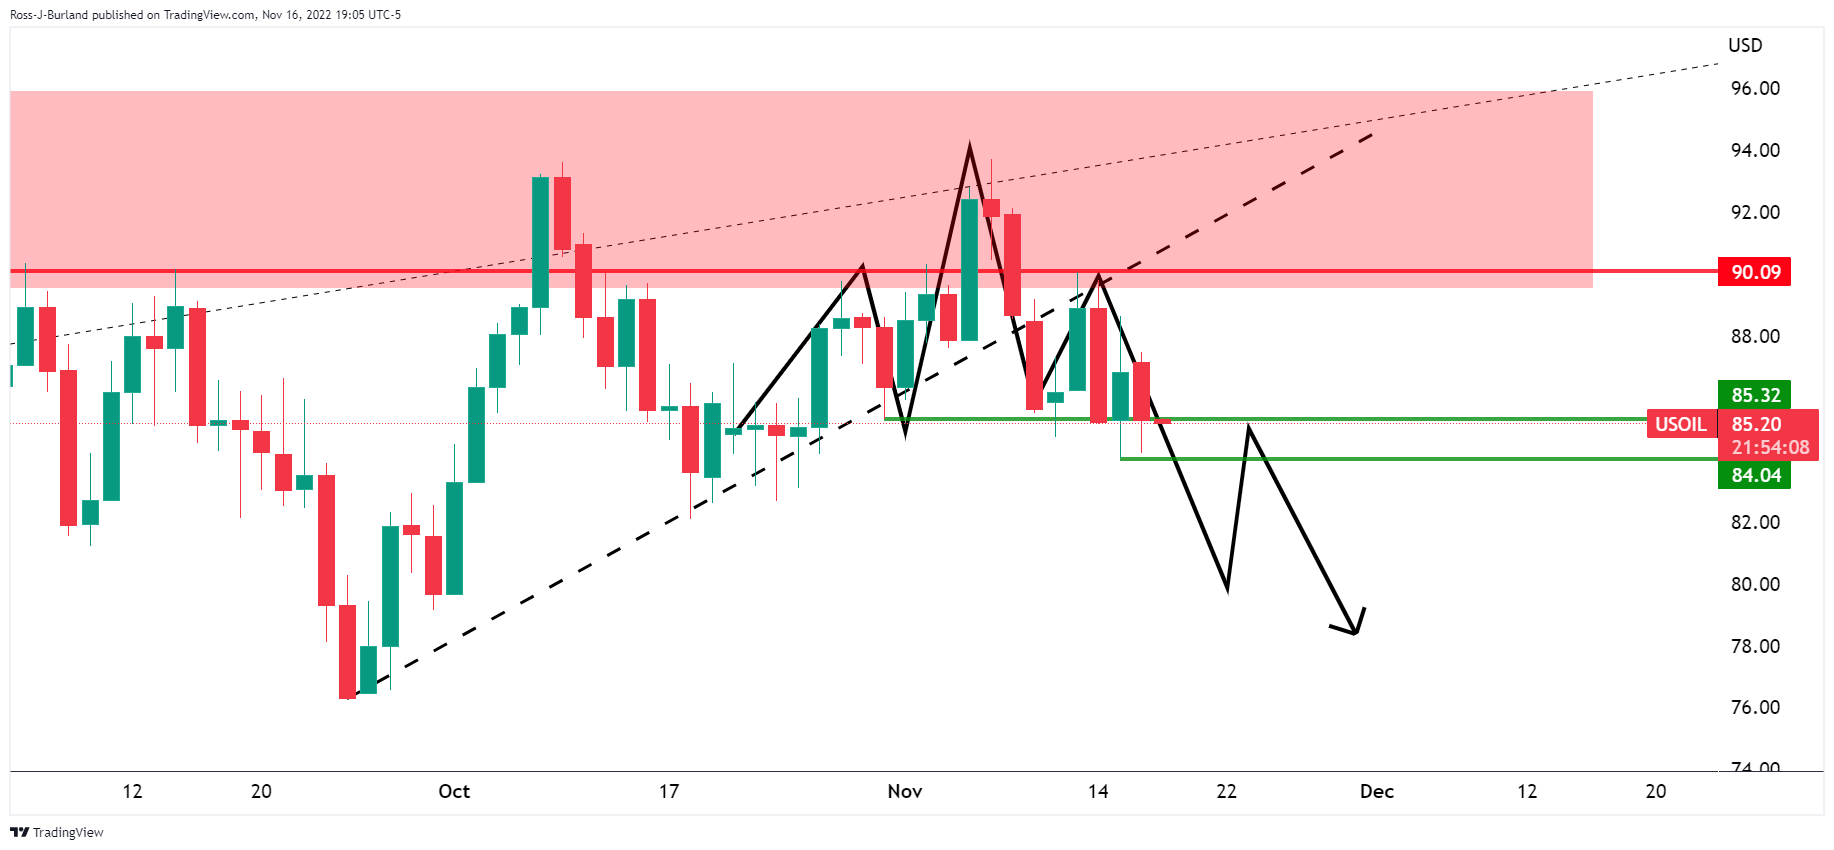
Bears broke the prior structure of 85.32 but have been unable to follow through. A move below $84 the figure is now required to shift the bias fully.