GBP/USD Price Analysis: Bears take on critical trendline support
- GBP/USD bears are in the market below 1.2470.
- A break below 1.2415 will cement the downside bias.
As per the prior analysis, GBP/USD Price Analysis: Bears are moving in with eyes on 1.2350s, GBP/USD is carving out a topping formation and we have seen what could be the basis of a peak formation starting to be put into place in the lower time frames.
The following illustrates a bearish bias on the daily and hourly charts:
GBP/USD prior analysis
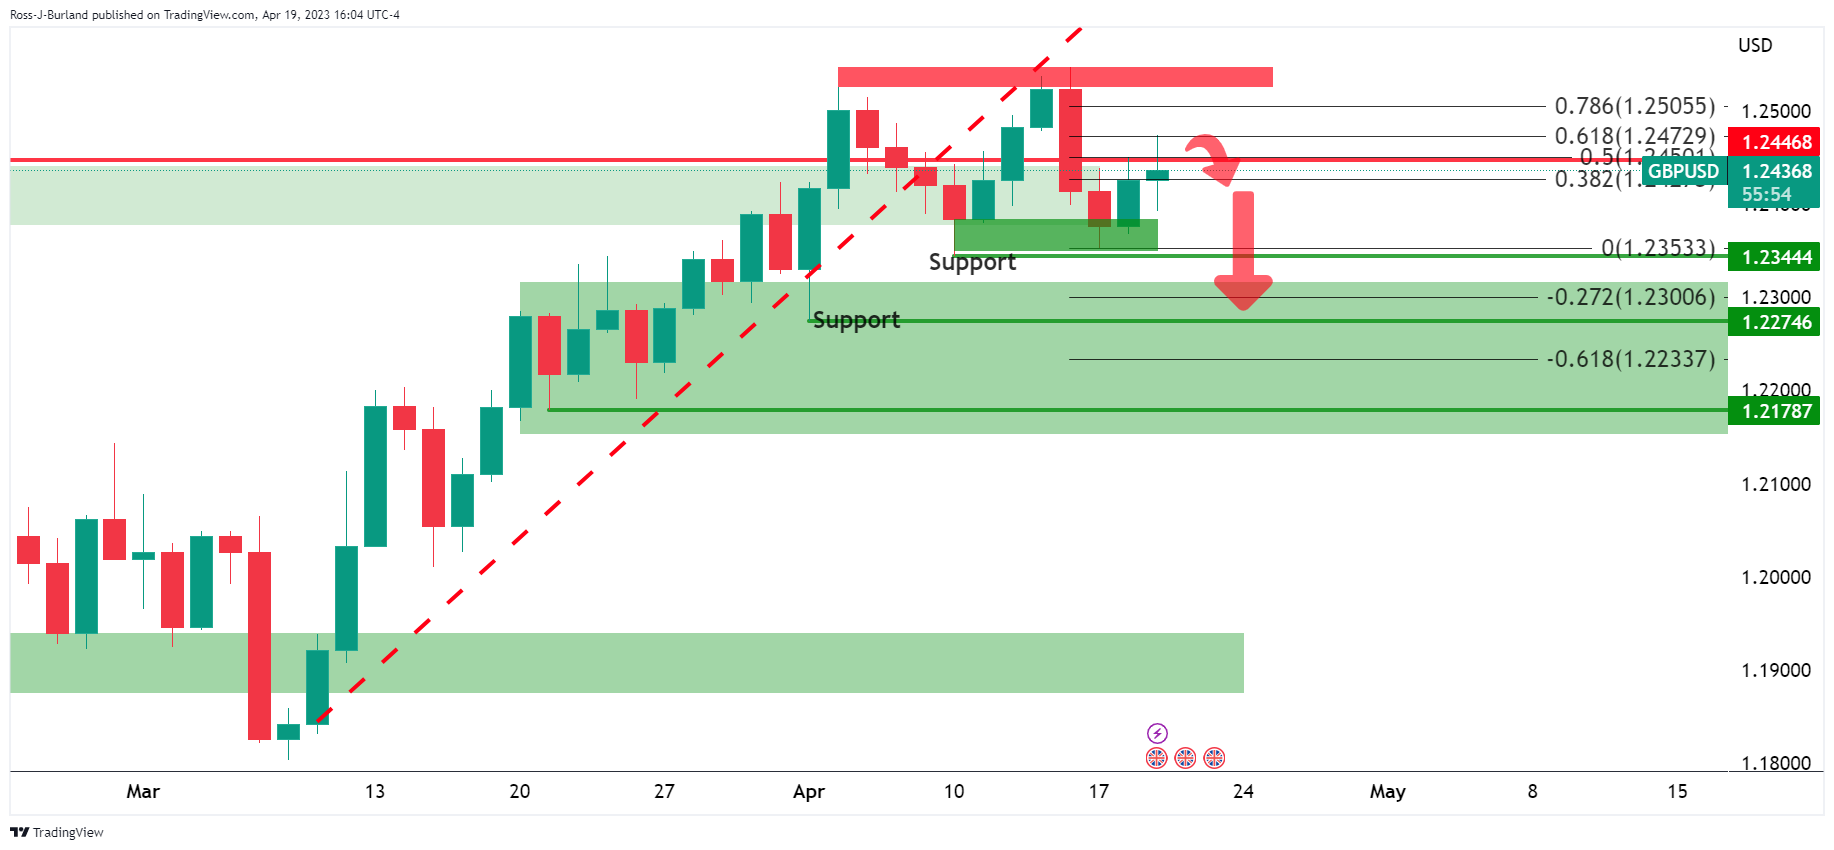
The resistance was holding up the price near 1.2550 and again at 1.2470 near a 61.8% Fibonacci retracement level.
GBP/USD daily chart
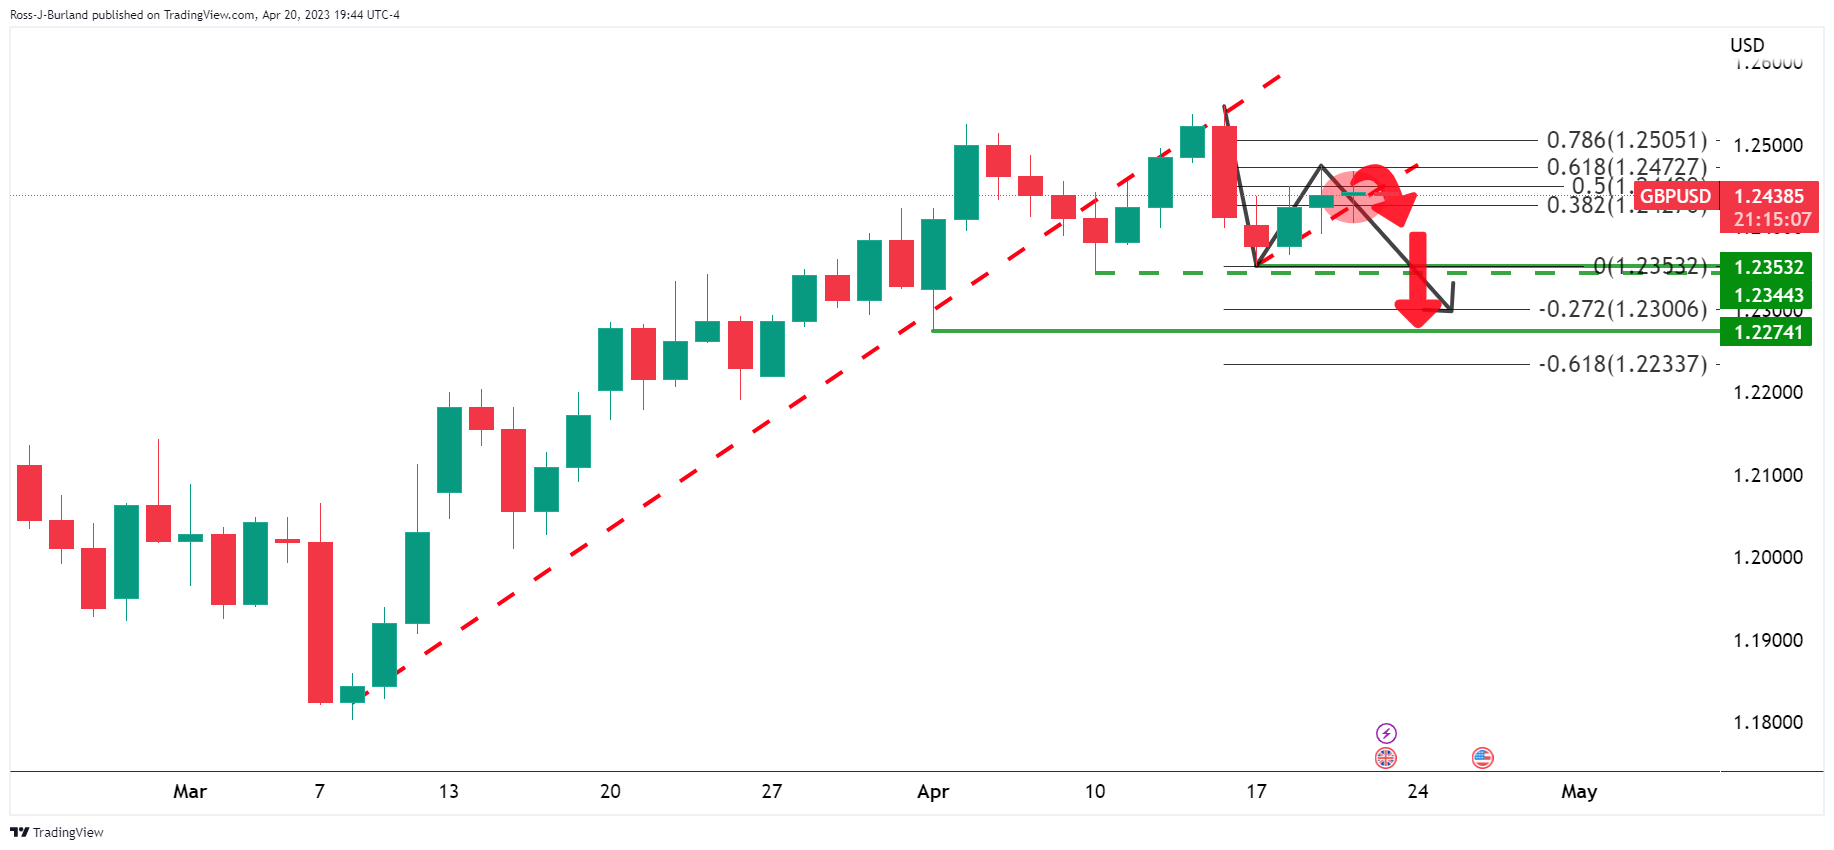
We have seen a doji on Thursday´s close and there there is now the possibility of a downside continuation.
GBP/USD H1 chart
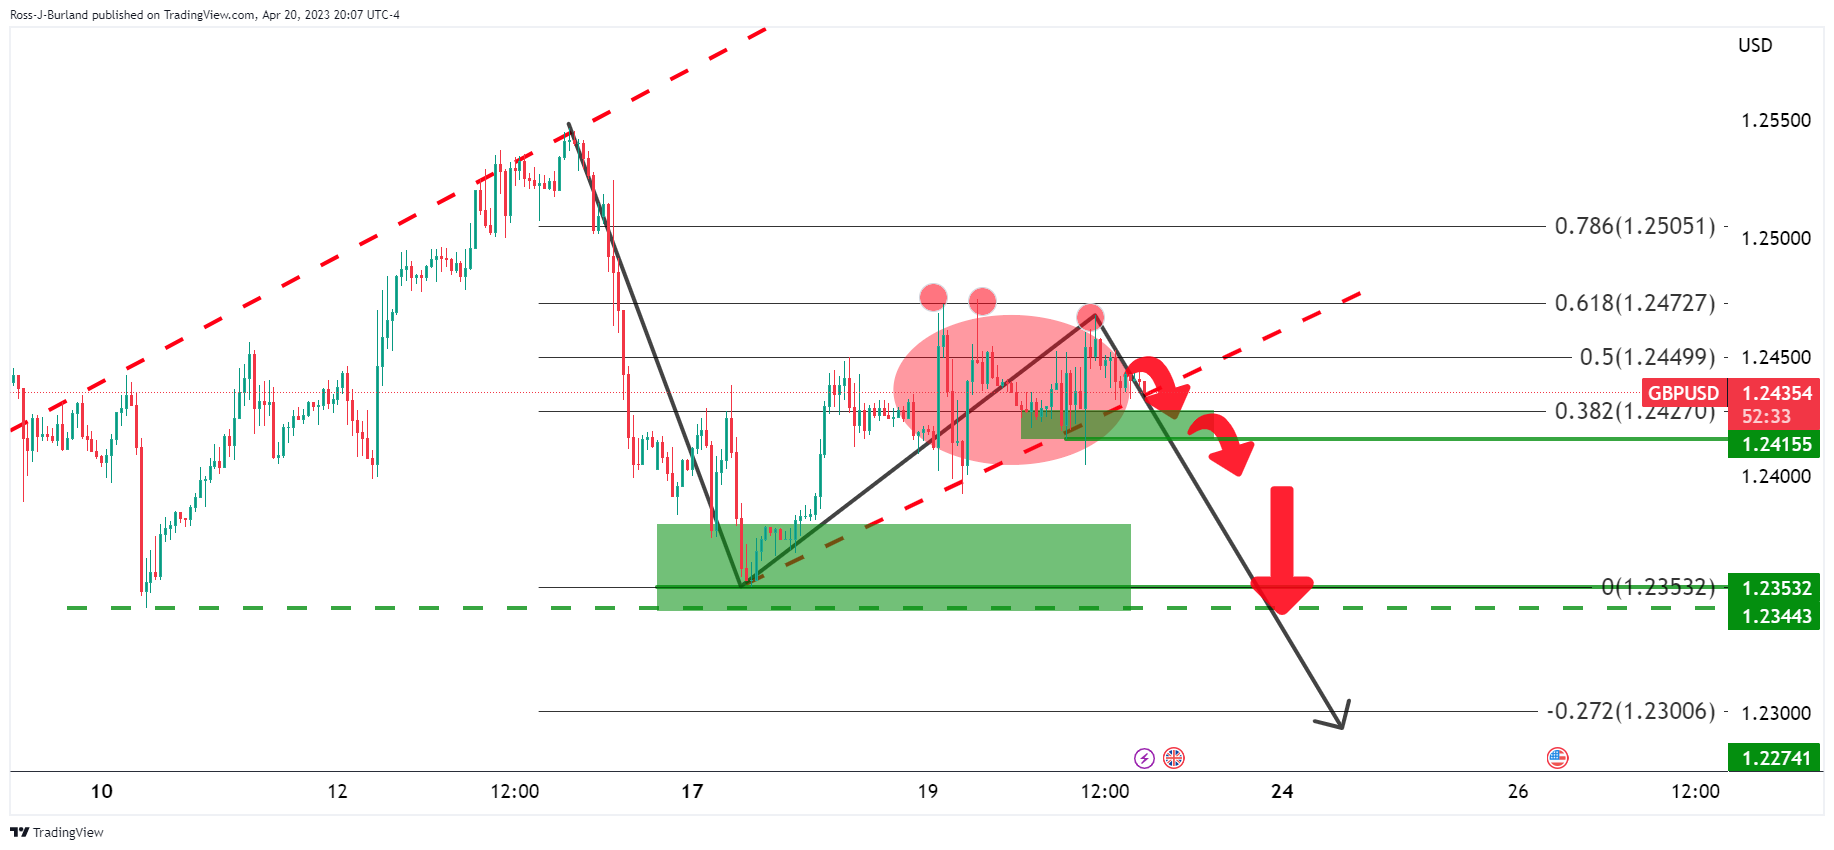
The hourly dynamic trendline support line is being tested and close below the daily chart´s 38.2% Fibonacci and then 1.2415 structure will be penetrating the support, cementing in the bearish bias for the days ahead.