Confirming you are not from the U.S. or the Philippines

یہ بیان دے کر، میں واضح طور پر یہ بتاتا اور تصدیق کرتا ہوں کہ:
  • میں امریکی شہری یا رہائشی نہیں ہوں
  • میں فلپائن کا رہائشی نہیں ہوں
  • میں بالواسطہ یا بلاواسطہ امریکی باشندوں کے 10 فیصد سے زیادہ شیئرز/ ووٹنگ کا حق/ امریکی باشندوں کے انٹرسٹ کا مالک نہیں ہوں اور/یا دوسرے ذرائع سے امریکی شہریوں یا رہائشیوں کو کنٹرول نہیں کرتا ہوں۔
  • میں بالواسطہ یا بلاواسطہ امریکی باشندوں کے 10 فیصد سے زیادہ شیئرز/ ووٹنگ کا حق/ انٹرسٹ کا مالک نہیں ہوں اور/ یا کسی دوسرے ذریعے سے امریکی شہری یا رہائشی کے کنٹرول میں نہیں ہوں۔
  • میں FATCA کے سیکشن (a)1504 کے معاملے میں امریکی شہریوں یا رہائشیوں کے ساتھ وابستہ نہیں ہوں
  • میں غلط اعلان کرنے پر اپنی ذمہ داری سے واقف ہوں۔
اس بیان کے مقاصد کے لئے، ریاستہائے متحدہ امریکہ کے تمام منحصر ممالک اور علاقوں کو امریکہ کے مرکزی علاقے کے برابر کردیا گیا ہے۔ میں اپنے اس بیان کی خلاف ورزی سے پیدا ہونے یا اس سے متعلق ہونے والے کسی بھی دعوے کے خلاف، بے ضرر آکٹا مارکیٹس انکارپوریٹڈ، اس کے ڈائریکٹرز اور افسران کا دفاع کرنے کا عہد کرتا ہوں۔
ہم آپ کی رازداری اور آپ کی ذاتی معلومات کے تحفظ کے لیے وقف ہیں۔ ہم محض اپنی پراڈکٹس اور سروسز کے متعلق خصوصی پیشکشوں اور اہم معلومات فراہم کرنے کے لیے ای میلز اکٹھا کرتے ہیں۔ اپنا ای میل ایڈریس دے کر، آپ ہم سے ایسے ای میلز وصول کرنے پر اتفاق کرتے ہیں۔ اگر آپ انسبسکرائب کرنا چاہتے ہیں یا کوئی سوالات یا خدشات ہوں تو، ہماری کسٹمر سپورٹ کو لکھیں۔
Octa trading broker
ٹریڈنگ اکاؤنٹ کھولیں
Test
Back

NZD/USD Price Analysis: Bird flies into a critical juncture ahead of potentially high volatility

  • NZD/USD bulls in the market but are meeting key resistance.
  • Trendline support could come under pressure with high volatility anticipated. 

As per the prior analysis, NZD/USD Price Analysis: Bulls take on 0.62s and eye 50% mean reversion, whereby it was stated that the price was running towards a micro daily trendline resistance and that a correction from around the resistance could play out, the following eventuated:

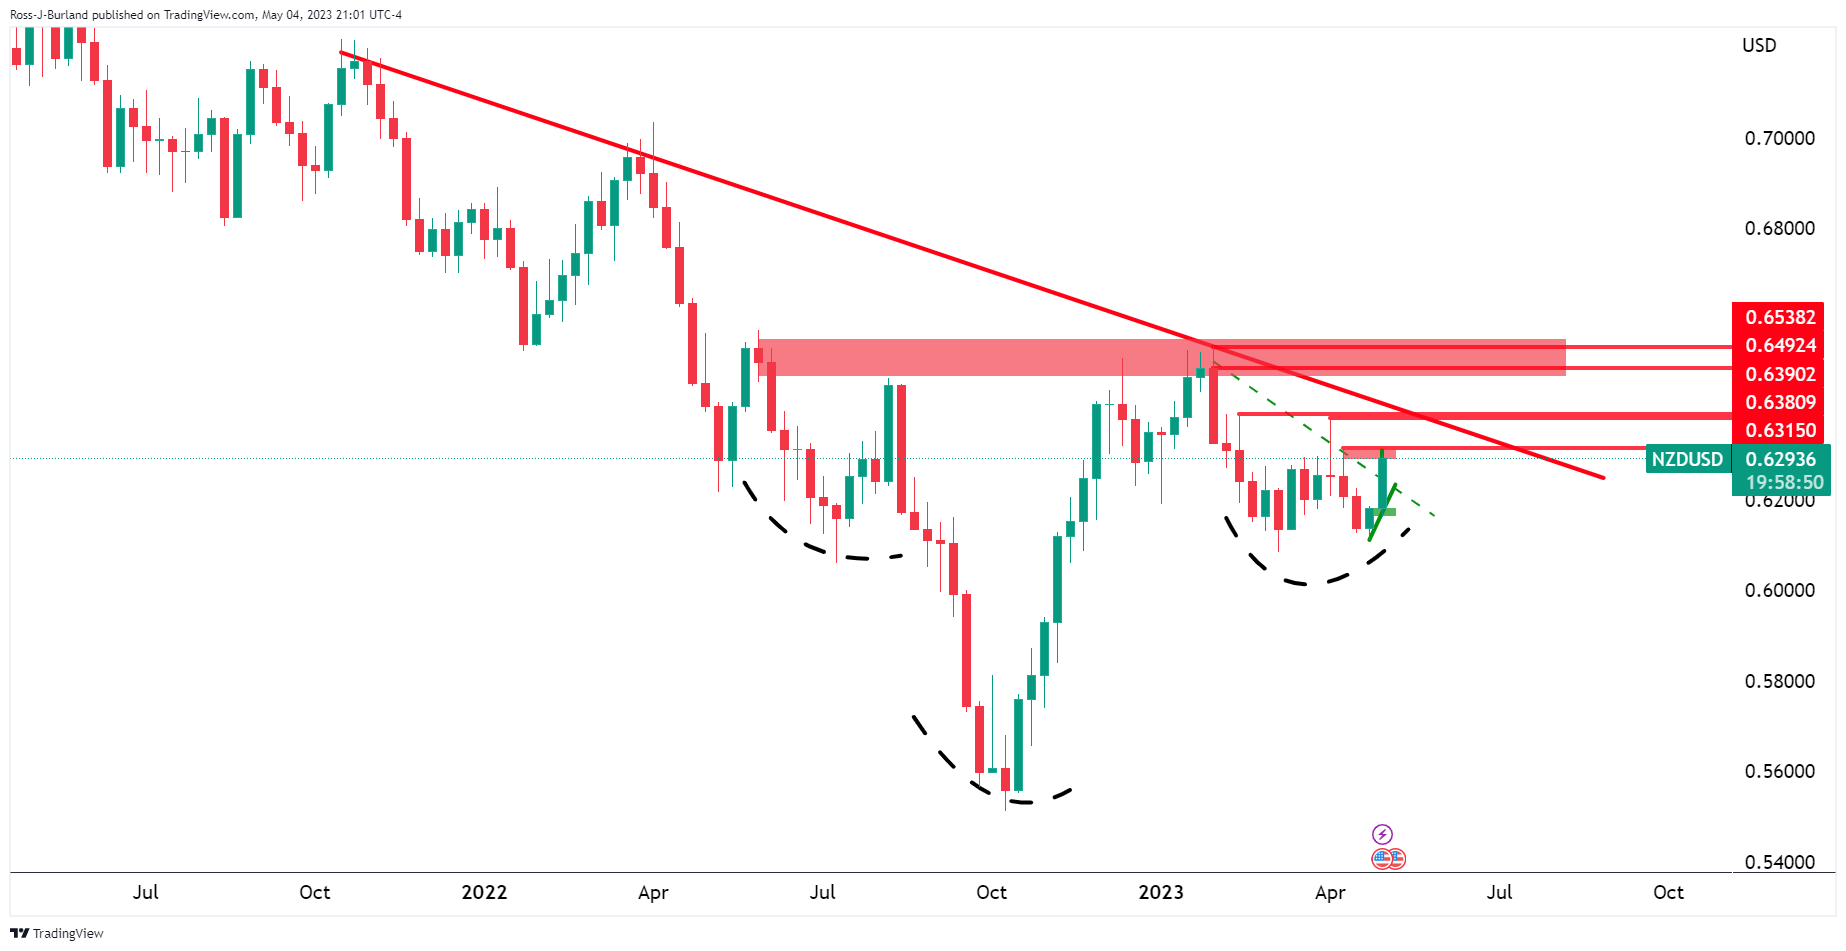
NZD/USD prior analysis

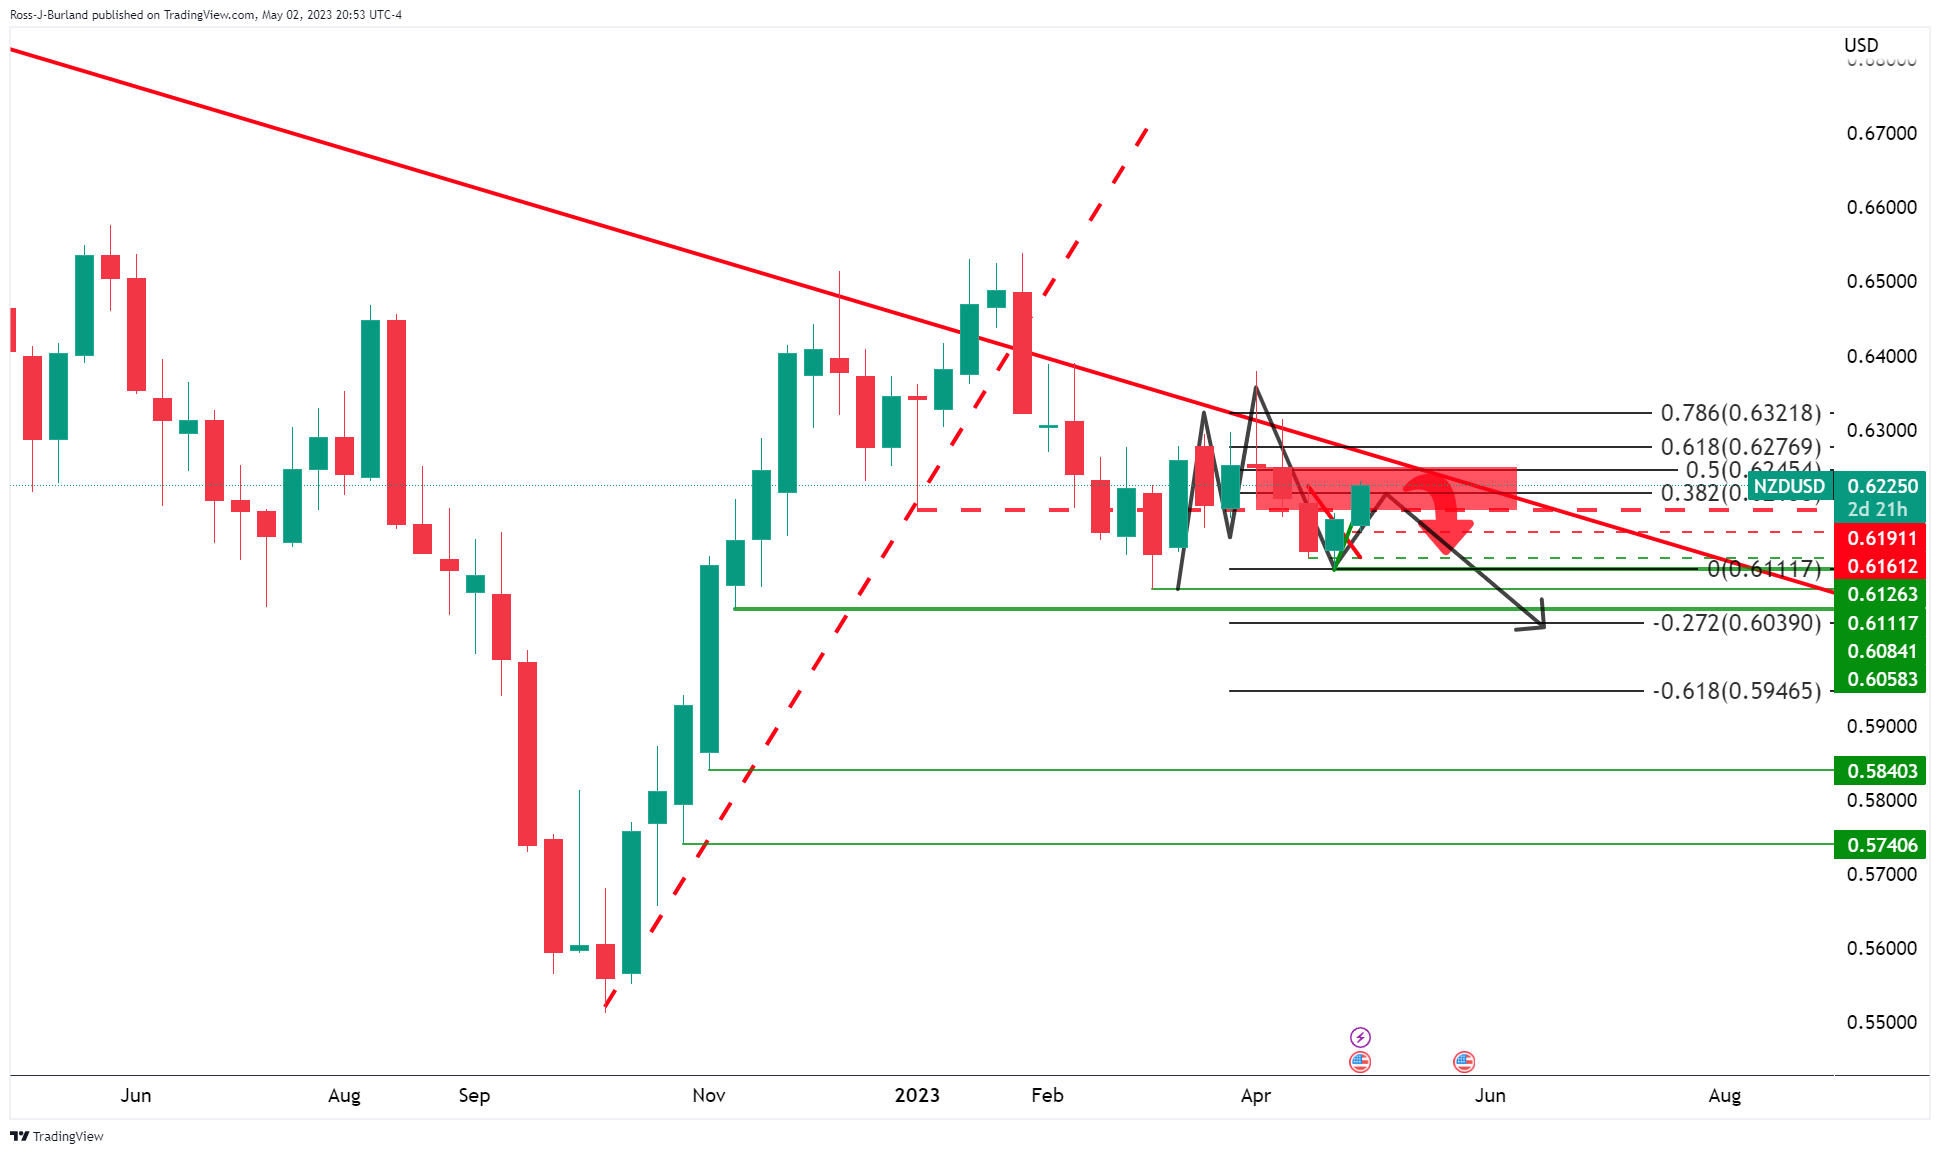
The weekly chart showed the price moving into the neckline resistance area that is below the trendline resistance. A move beyond the neckline was said to leave the trendline resistance vulnerable with the 50% mean reversion area eyed. 

NZD/USD H4 chart

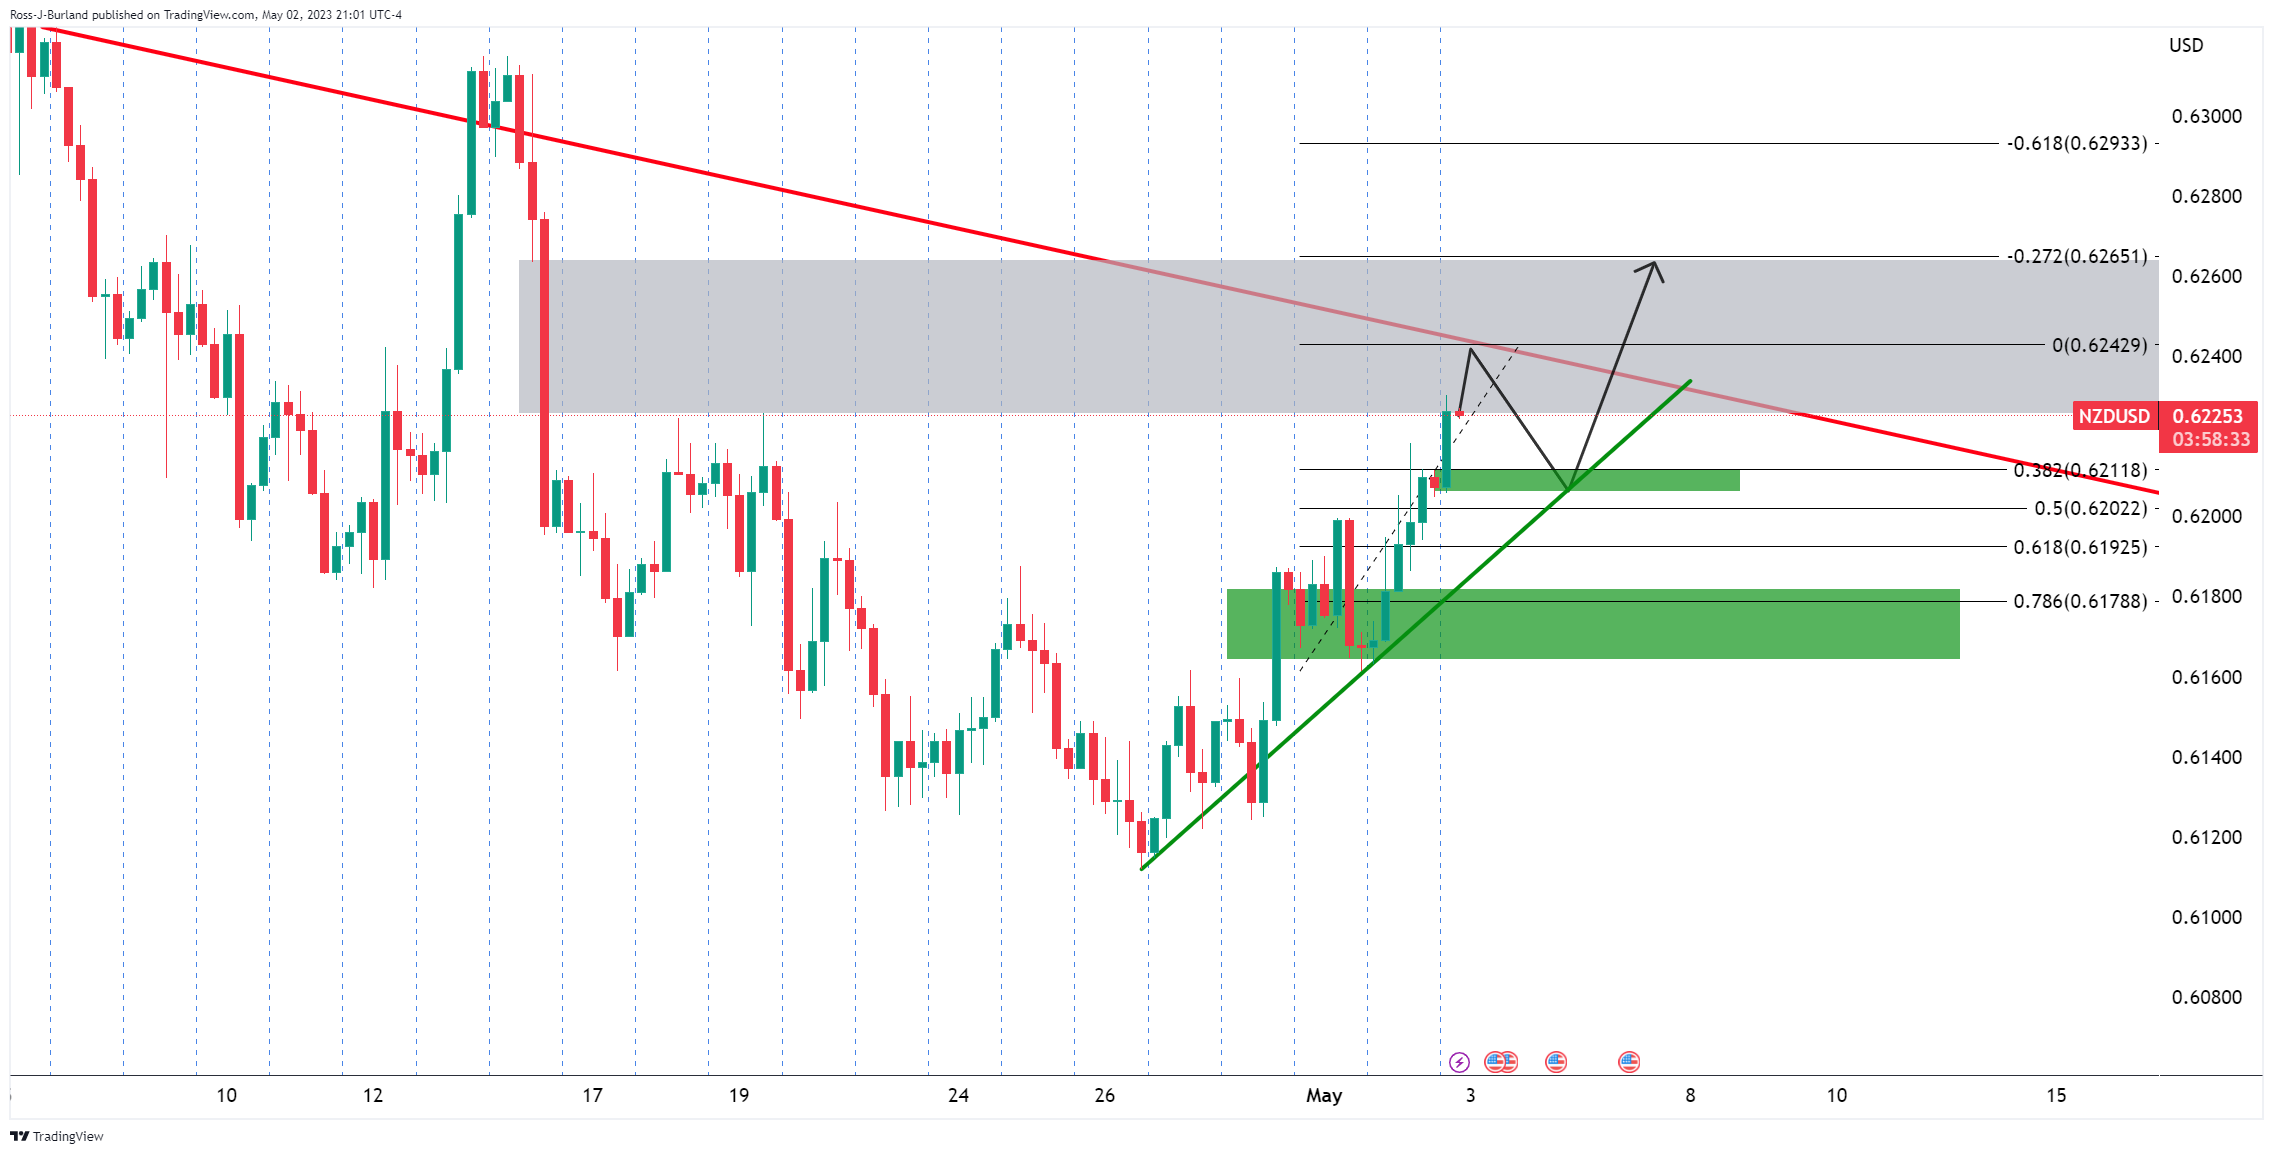
It was stated that the bears could be looking to target the 38.2% Fibonacci in this regard on a Fibo measurement drawn between the swing lows near 0.6160 and the trendline resistance.

NZD/USD updates

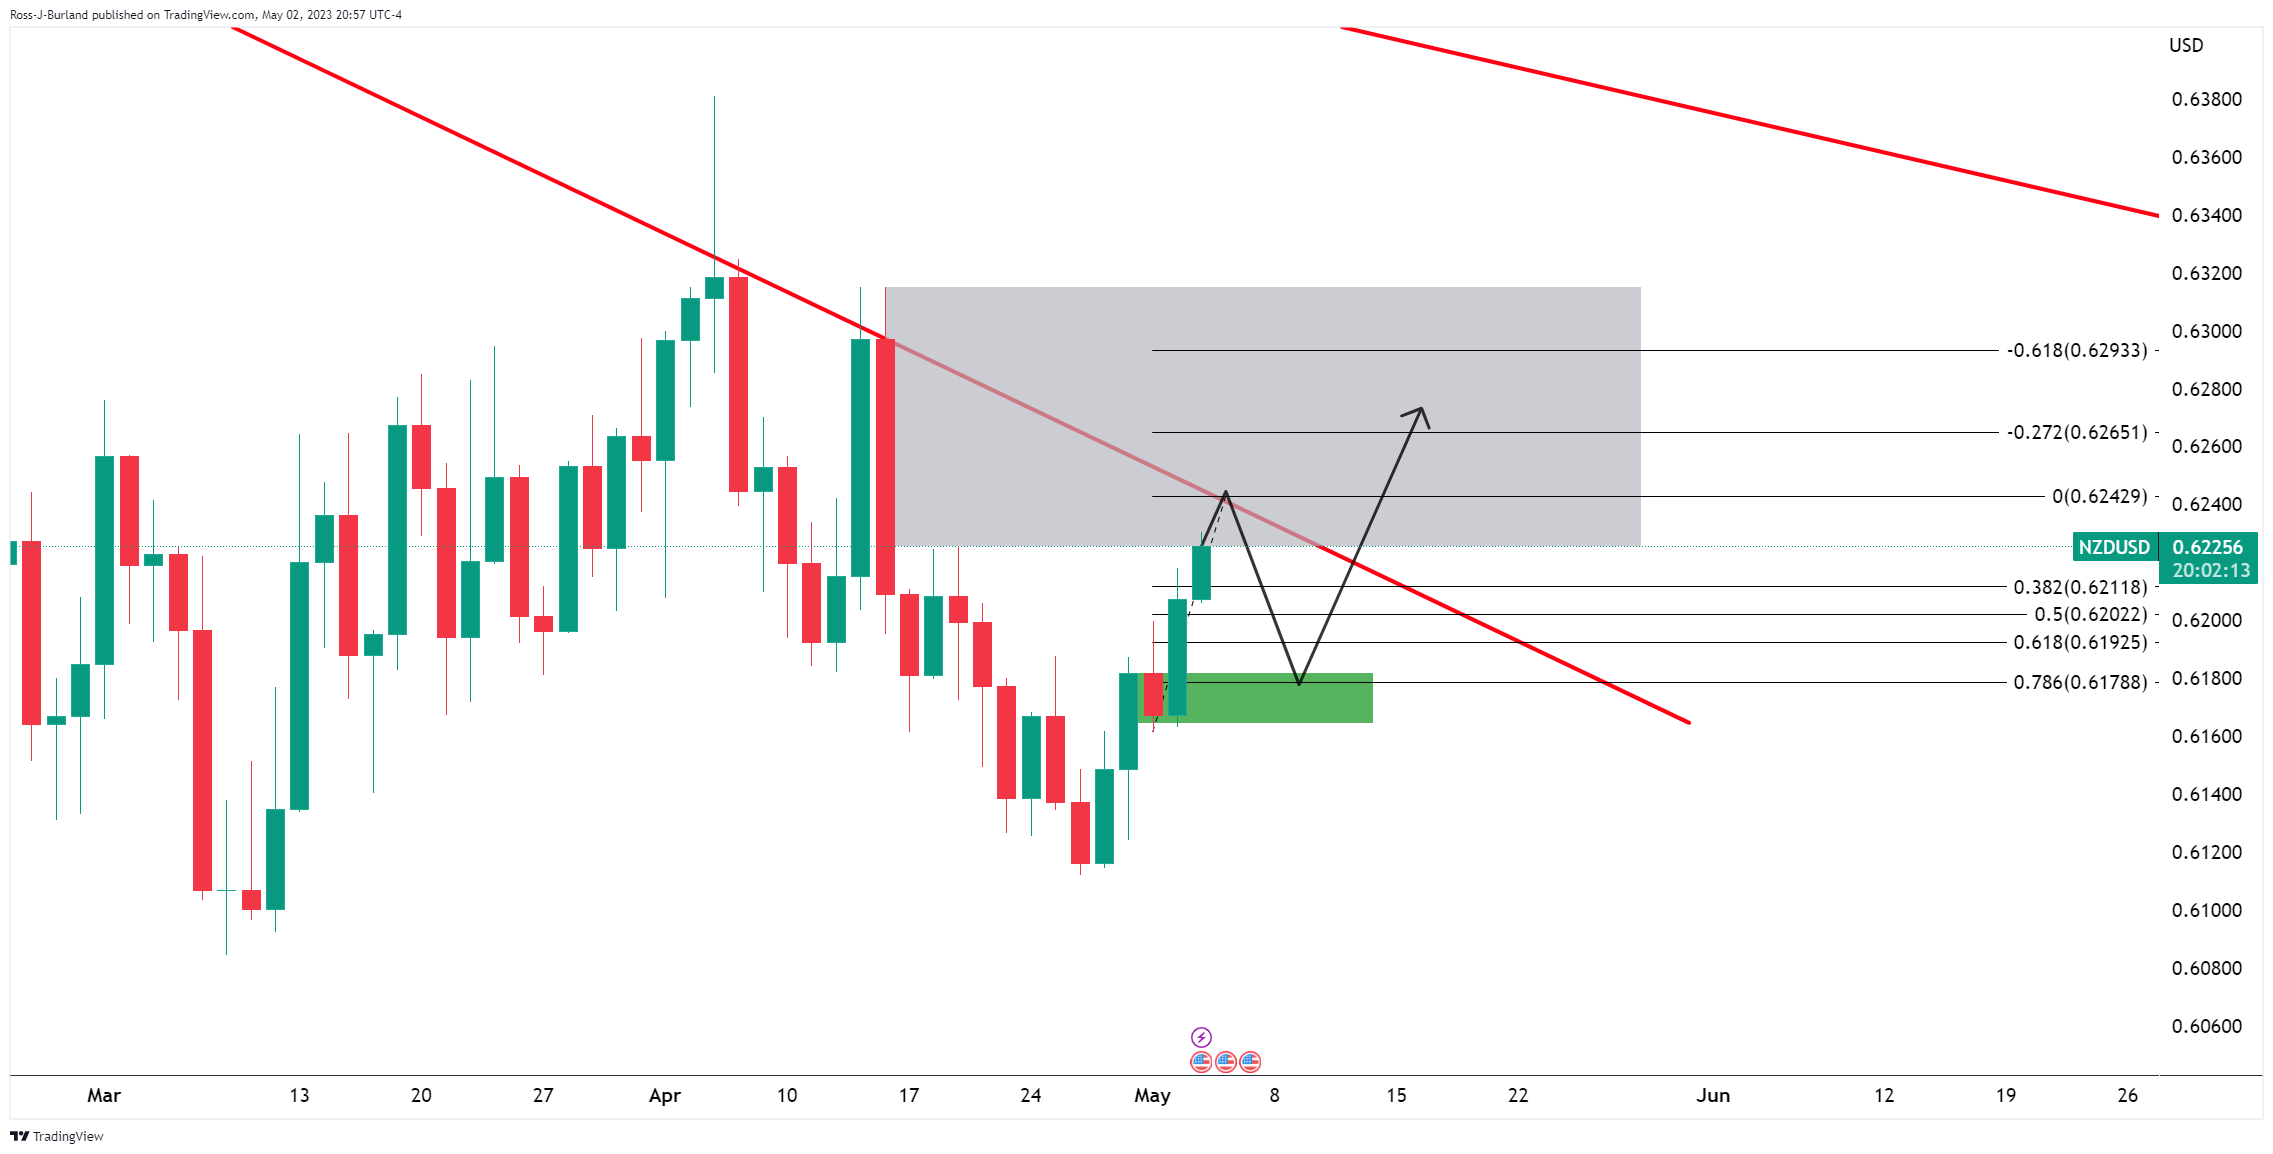
It was also noted that there was a price imbalance in the greyed area on the 4-hour chart that could have been mitigated if the bulls were to stay in control.

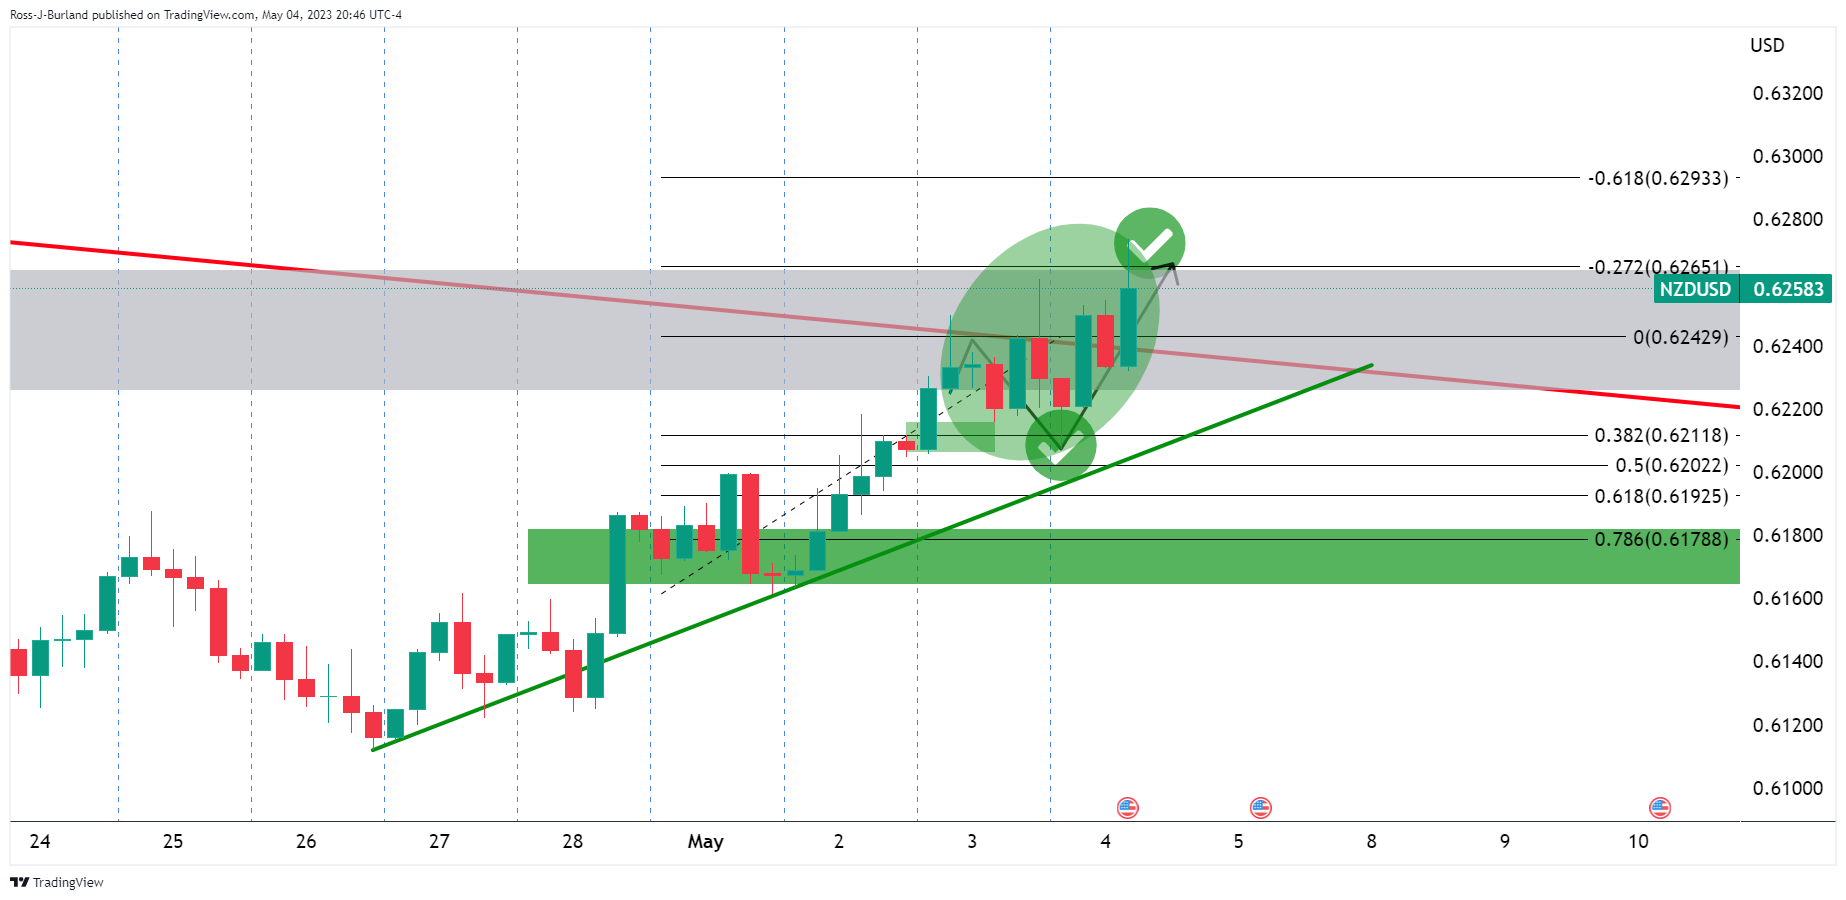
We had the touch of the 38.2% ratio and a subsequent rally into the 0.6260s. In turn, this hit the 50% mean reversion as per the M-formation on the weekly chart:

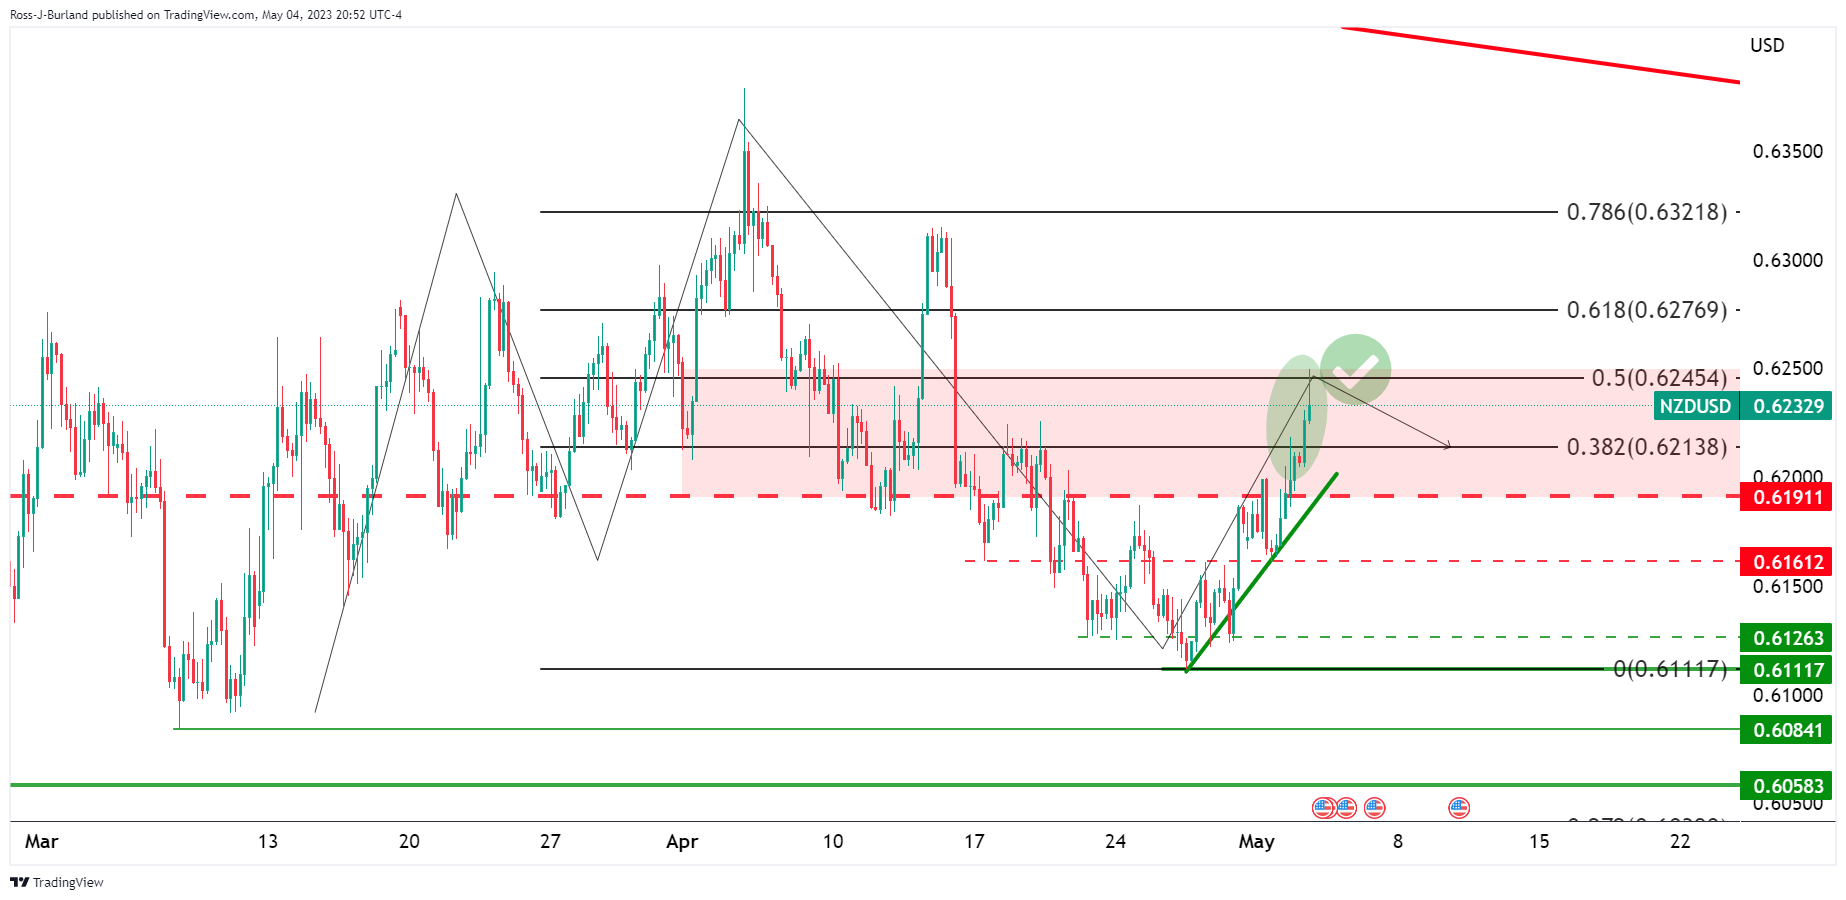
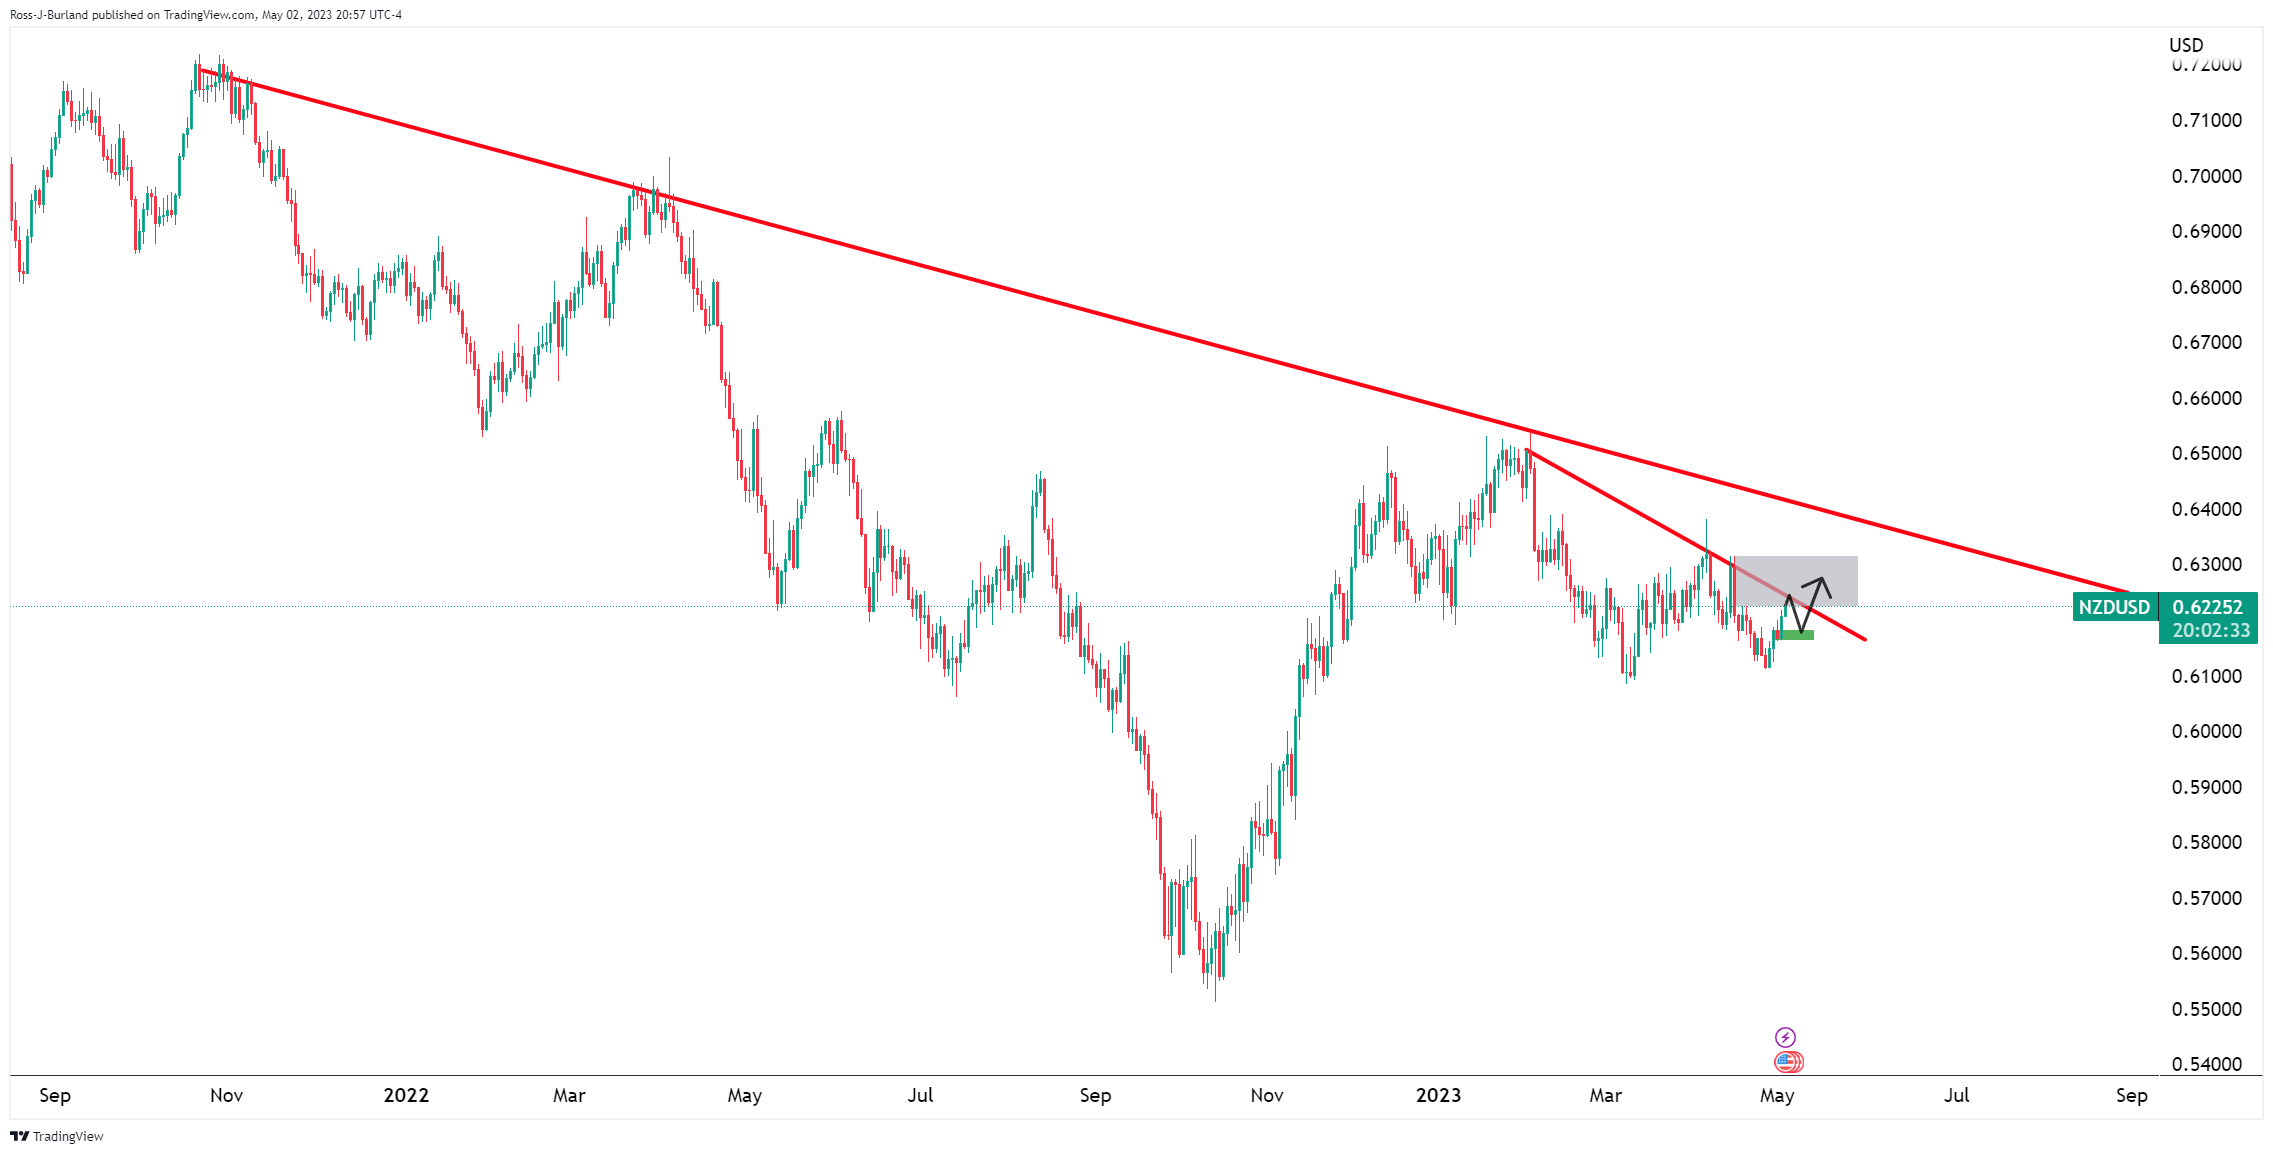
However, the bulls stayed in control and have taken on territory towards 0.63 the figure as per the following weekly chart:

Note the bullish inverses head and shoulders as well?

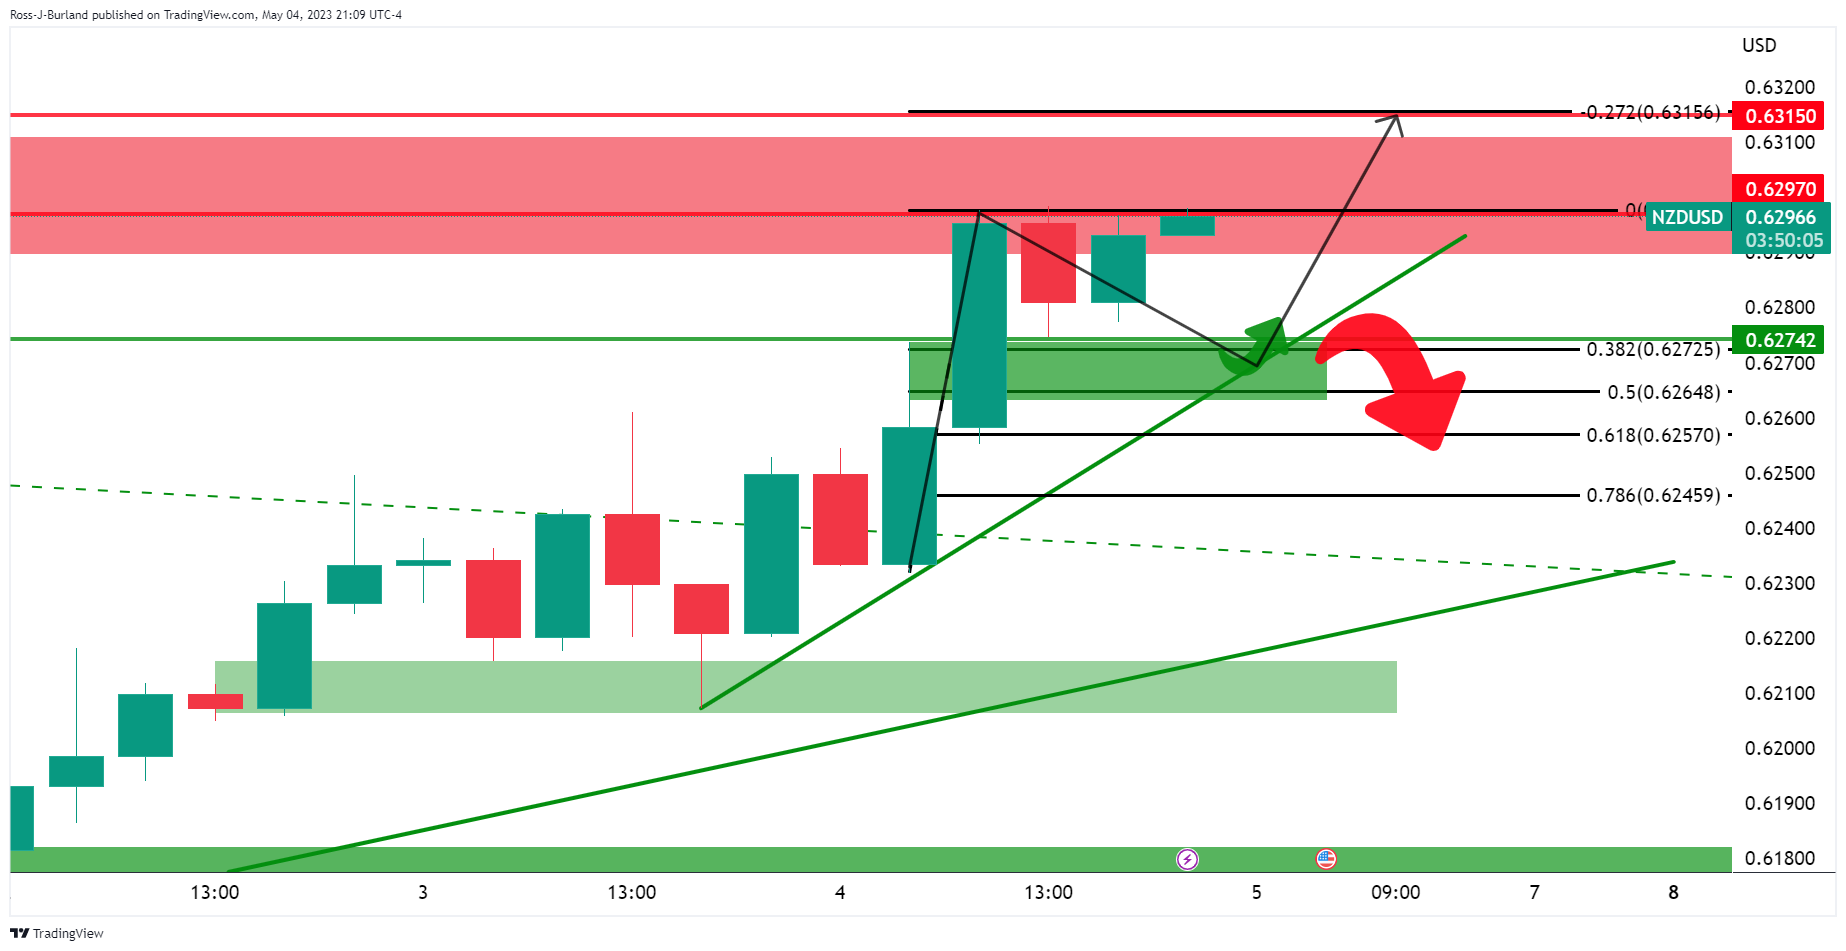
Moving to the H4 chart:

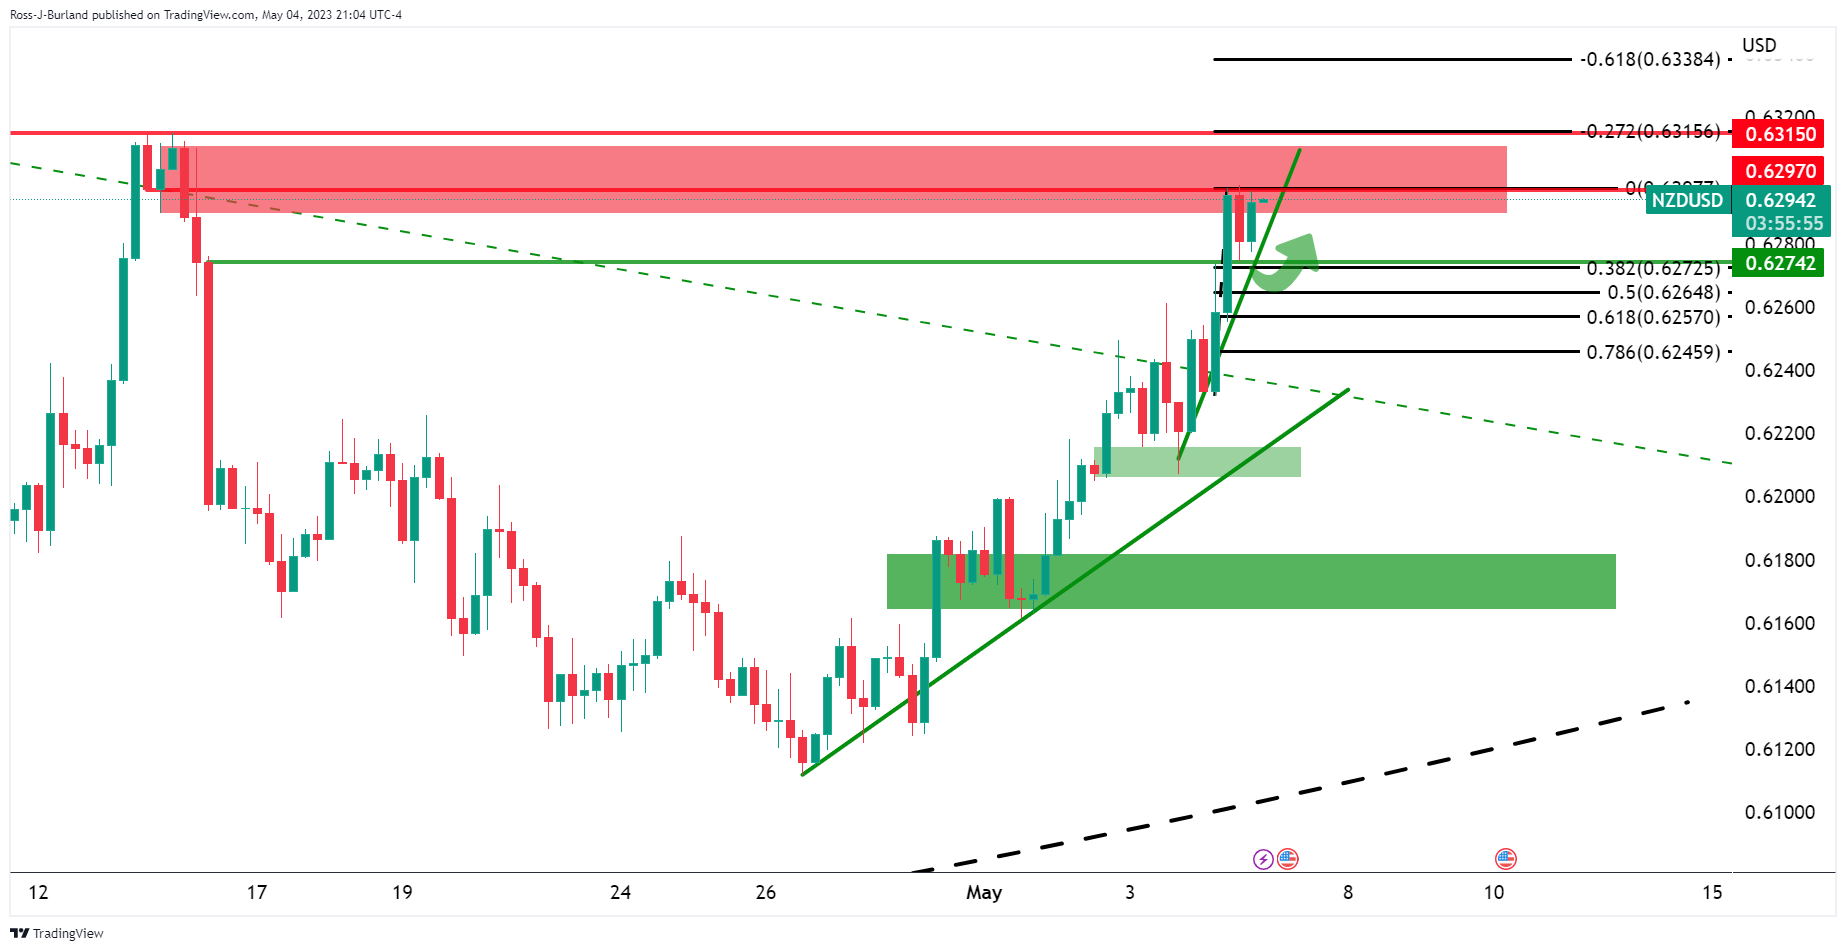
We are at a critical area of resistance here and a test of the supporting dynamic trendline could be in play, especially given the high volatility event in the Nonfarm Payrolls in the US session coming up. 0.6270s will be key in this regard that is meeting the 38.2% Fibonacci ratio and structural support:


USD/CAD: Mildly offered below 1.3550 amid steady Oil price, focus on US, Canada employment data

USD/CAD renews a two-week low around 1.3520 as it cheers broad US Dollar weakness, as well as hawkish commentary from the Bank of Canada (BoC) Governo
مزید پڑھیں Previous

EUR/JPY faces barricades around 148.00 after a recovery move ahead of Eurozone Retail Sales

The EUR/JPY pair is struggling in extending its recovery above the immediate resistance of 148.00 in the Asian session. The cross is experiencing pres
مزید پڑھیں Next