USD/RUB extends losses, holds ground above 93.00 psychological level
- USD/RUB continues to trade lower after CBR’s rate hikes.
- USD/RUB fall could inculcate a sense of caution in the market.
- MACD and RSI reinforce the confirmation of the bearish bias.
USD/RUB retracts the gains registered on Thursday, presently, trading at a lower level around 93.10 during the early hours of the European session on Friday. The pair is facing downward pressure, which could be attributed to the emergency rate hikes implemented by the Central Bank of the Russian Federation (CBR) on Tuesday.
The USD/RUB pair experiences losses despite improved US economic data, which could inculcate a sense of caution in the market. The optimism of Russian policymakers stands in contrast to the mixed stance among the members of the US Federal Reserve (Fed). However, firmer US Treasury yields and mostly upbeat US data could be enough to support the USD/RUB pair. Additionally, Uncertainties in the market regarding the CBR’s ability to protect the Russian Ruble (RUB) against the US Dollar’s (USD) strength could leave traders indecisive.
The US Dollar Index (DXY) recovers the losses incurred on Thursday, underpinning the USD/RUB pair. Spot trades higher around 103.50. This recovery of the US Dollar (USD) is driven by the improved US economic data, prompting a cautious sentiment within the market as it looks for additional cues regarding the inflation outlook.
Russian Ruble Technical Analysis
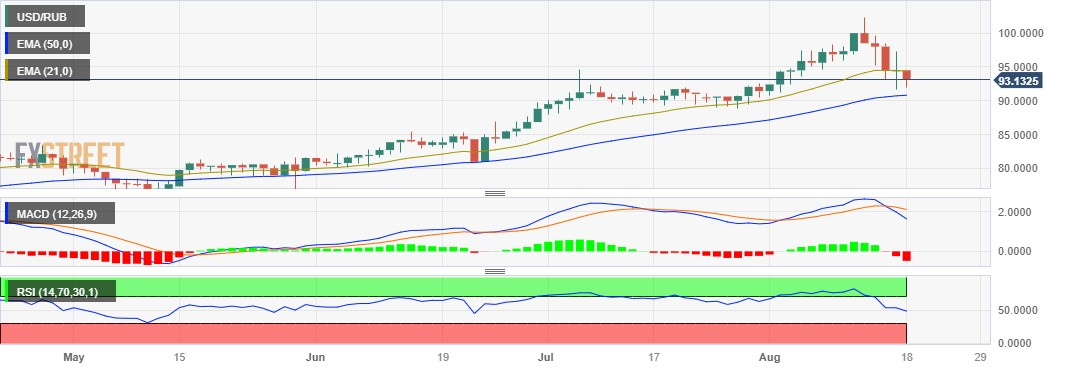
USD/RUB continues the downward trend that started on Monday. The pair could find immediate support around a two-week low at 91.5250. A firm break below the latter could push the USD/RUB pair to navigate the region around the 50-day Exponential Moving Average (EMA) at 90.82.
The Moving Average Convergence Divergence (MACD) line stays in the negative territory of the centerline and shows divergence below the signal line, which indicates the bearish sentiment in the USD/RUB pair. The 14-day Relative Strength Index (RSI) continues to remain below 50, reinforcing the confirmation of the bearish bias.
On the upside, the 21-day EMA at 94.36 emerges as the key resistance, followed by the 94.50 psychological level.
USD/RUB: Daily Chart