Confirming you are not from the U.S. or the Philippines

یہ بیان دے کر، میں واضح طور پر یہ بتاتا اور تصدیق کرتا ہوں کہ:
  • میں امریکی شہری یا رہائشی نہیں ہوں
  • میں فلپائن کا رہائشی نہیں ہوں
  • میں بالواسطہ یا بلاواسطہ امریکی باشندوں کے 10 فیصد سے زیادہ شیئرز/ ووٹنگ کا حق/ امریکی باشندوں کے انٹرسٹ کا مالک نہیں ہوں اور/یا دوسرے ذرائع سے امریکی شہریوں یا رہائشیوں کو کنٹرول نہیں کرتا ہوں۔
  • میں بالواسطہ یا بلاواسطہ امریکی باشندوں کے 10 فیصد سے زیادہ شیئرز/ ووٹنگ کا حق/ انٹرسٹ کا مالک نہیں ہوں اور/ یا کسی دوسرے ذریعے سے امریکی شہری یا رہائشی کے کنٹرول میں نہیں ہوں۔
  • میں FATCA کے سیکشن (a)1504 کے معاملے میں امریکی شہریوں یا رہائشیوں کے ساتھ وابستہ نہیں ہوں
  • میں غلط اعلان کرنے پر اپنی ذمہ داری سے واقف ہوں۔
اس بیان کے مقاصد کے لئے، ریاستہائے متحدہ امریکہ کے تمام منحصر ممالک اور علاقوں کو امریکہ کے مرکزی علاقے کے برابر کردیا گیا ہے۔ میں اپنے اس بیان کی خلاف ورزی سے پیدا ہونے یا اس سے متعلق ہونے والے کسی بھی دعوے کے خلاف، بے ضرر آکٹا مارکیٹس انکارپوریٹڈ، اس کے ڈائریکٹرز اور افسران کا دفاع کرنے کا عہد کرتا ہوں۔
ہم آپ کی رازداری اور آپ کی ذاتی معلومات کے تحفظ کے لیے وقف ہیں۔ ہم محض اپنی پراڈکٹس اور سروسز کے متعلق خصوصی پیشکشوں اور اہم معلومات فراہم کرنے کے لیے ای میلز اکٹھا کرتے ہیں۔ اپنا ای میل ایڈریس دے کر، آپ ہم سے ایسے ای میلز وصول کرنے پر اتفاق کرتے ہیں۔ اگر آپ انسبسکرائب کرنا چاہتے ہیں یا کوئی سوالات یا خدشات ہوں تو، ہماری کسٹمر سپورٹ کو لکھیں۔
Test
Back

NZD/USD Price Analysis: Forming a rectangle as it unfolds in a range

  • NZD/USD trades in a range which could represent part of a Bull Flag continuation pattern.
  • Conditional on a break above the range highs the pair could rally up to the targets for the Bull Flag. 
  • Alternatively a break lower is possible, bringing the uptrend into doubt. 

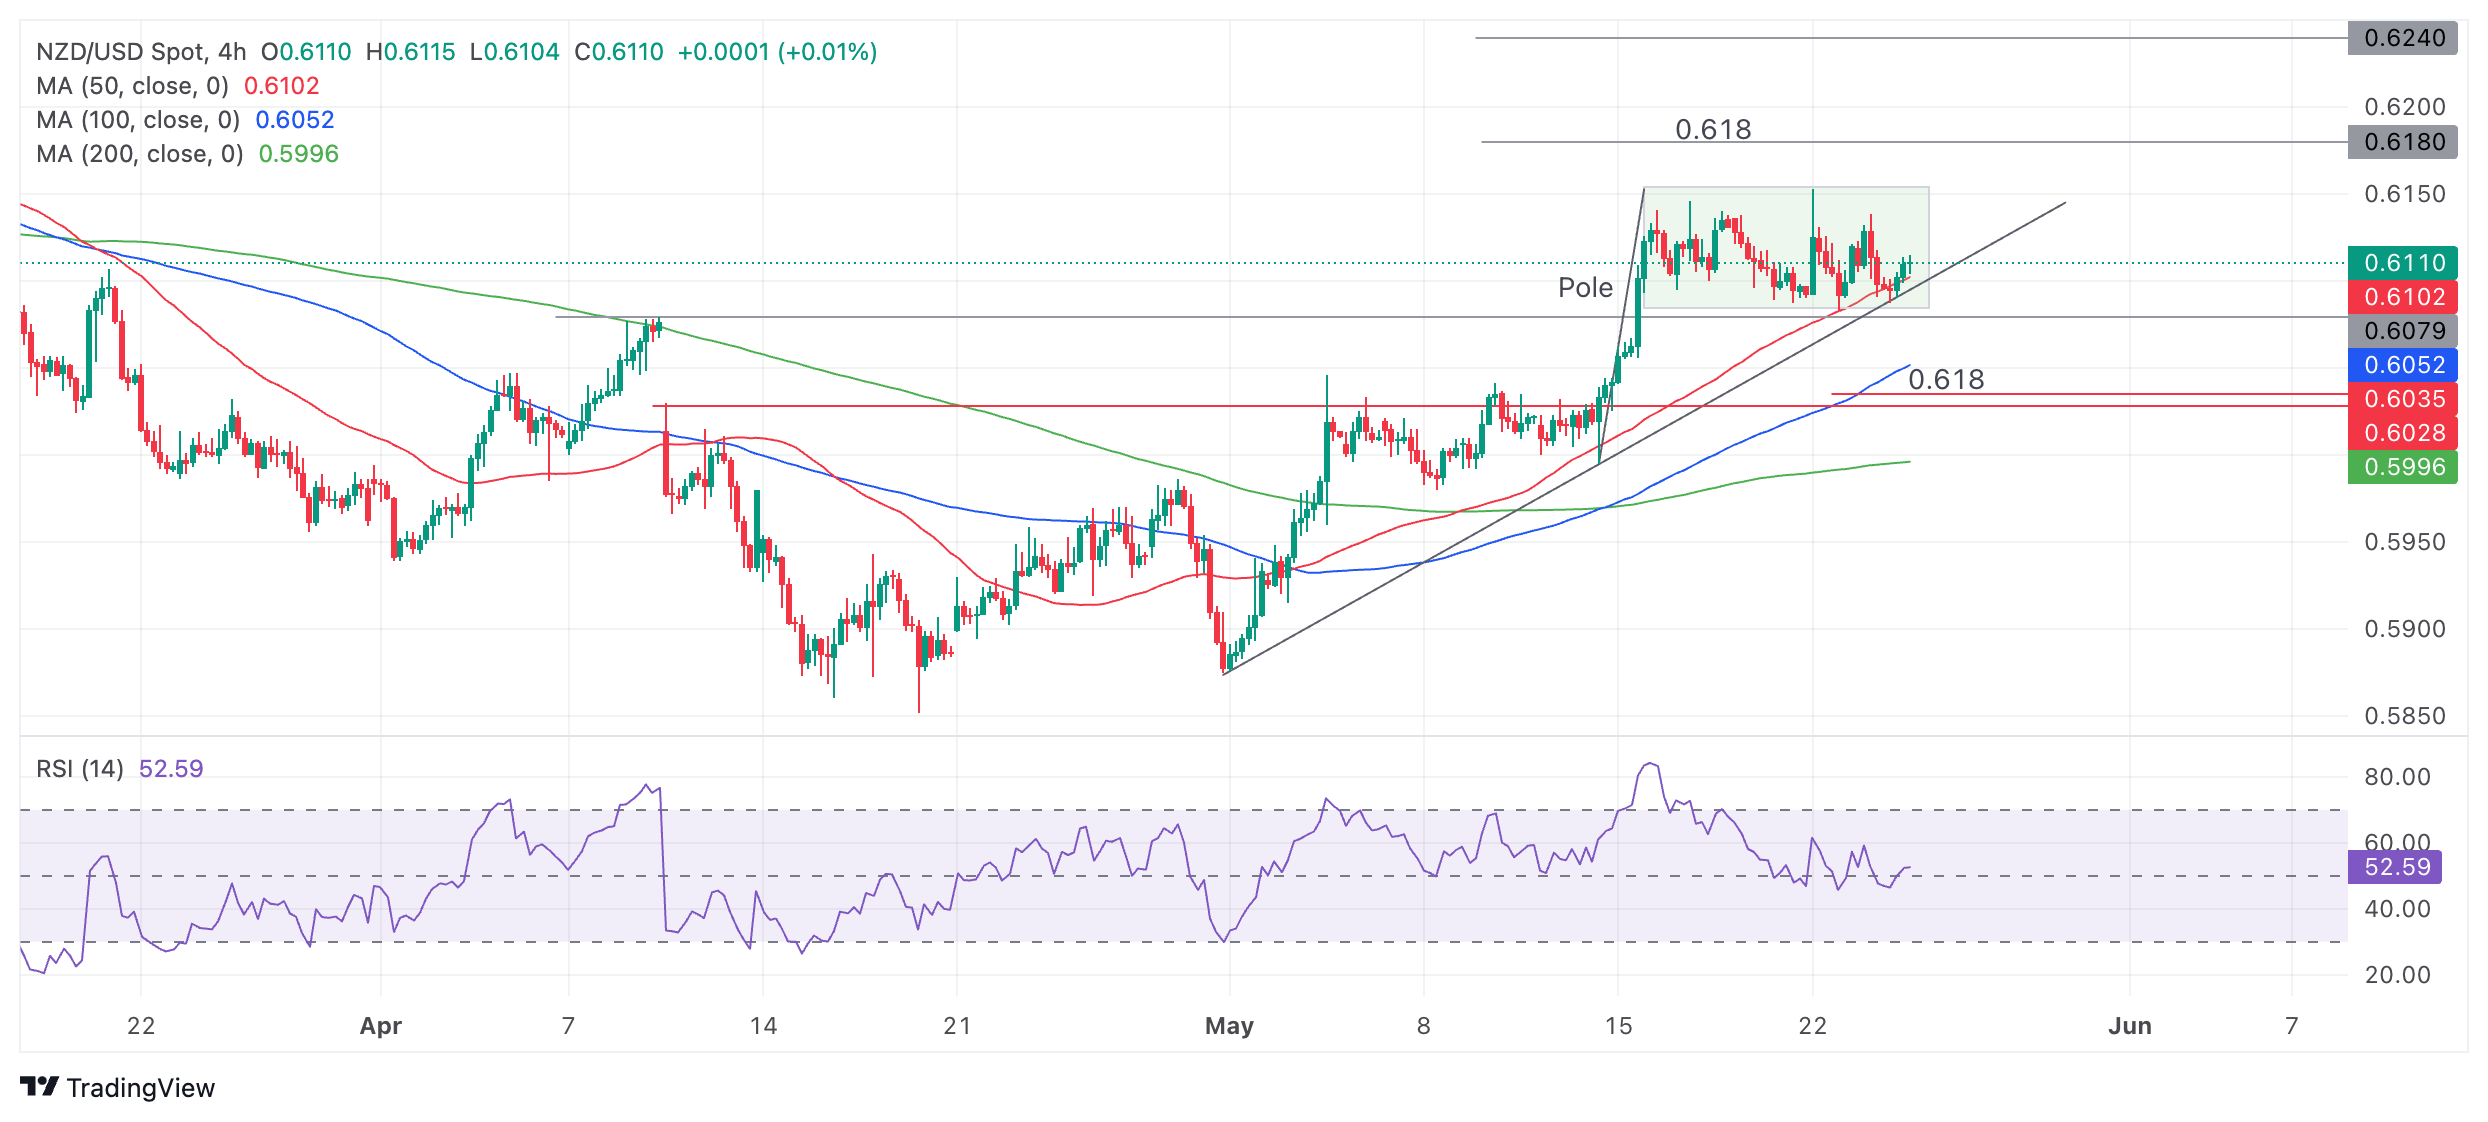
NZD/USD has spent the last week or so forming a range bound consolidation (shaded rectangle on chart) which could represent the flag square of a Bull Flag continuation pattern. 

The pair is probably in an uptrend on a short-term basis, favoring more upside in line with the saying “the trend is your friend”, however, a break above the rectangle’s highs at 0.6153 would give more confirmation of an extension higher. 

NZD/USD 4-hour Chart 

Such a breakout would probably see the price rally up to 0.6180, the first target for the Bull Flag pattern. This is calculated by taking the length of the “pole” and extrapolating it by a 0.618 Fibonacci ratio from the base of the rectangle higher. This is the conservative target for the pattern but a more bullish move could even reach the 0.6240 target at the 100% extension of the pole higher. 

A breakdown is also possible, however, and a break on a closing basis below the rectangle’s base would negate the Bull Flag hypothesis and suggest a more bearish tone to the chart. Such a break would also pierce the trendline for the move up during May and likely see NZD/USD decline to a downside target at 0.6035, the 0.618 Fib. ratio of the height of the rectangle extrapolated lower.  

United States UoM 5-year Consumer Inflation Expectation below expectations (3.1%) in May: Actual (3%)

United States UoM 5-year Consumer Inflation Expectation below expectations (3.1%) in May: Actual (3%)
مزید پڑھیں Previous

EUR/GBP recovers to 0.8530 as ECB Schnabel disagrees with rate cuts in July

The EUR/GBP pair bounces back from the psychological support of 0.8500 and recovers to 0.8530 in Friday’s New York session.
مزید پڑھیں Next