Confirming you are not from the U.S. or the Philippines

یہ بیان دے کر، میں واضح طور پر یہ بتاتا اور تصدیق کرتا ہوں کہ:
  • میں امریکی شہری یا رہائشی نہیں ہوں
  • میں فلپائن کا رہائشی نہیں ہوں
  • میں بالواسطہ یا بلاواسطہ امریکی باشندوں کے 10 فیصد سے زیادہ شیئرز/ ووٹنگ کا حق/ امریکی باشندوں کے انٹرسٹ کا مالک نہیں ہوں اور/یا دوسرے ذرائع سے امریکی شہریوں یا رہائشیوں کو کنٹرول نہیں کرتا ہوں۔
  • میں بالواسطہ یا بلاواسطہ امریکی باشندوں کے 10 فیصد سے زیادہ شیئرز/ ووٹنگ کا حق/ انٹرسٹ کا مالک نہیں ہوں اور/ یا کسی دوسرے ذریعے سے امریکی شہری یا رہائشی کے کنٹرول میں نہیں ہوں۔
  • میں FATCA کے سیکشن (a)1504 کے معاملے میں امریکی شہریوں یا رہائشیوں کے ساتھ وابستہ نہیں ہوں
  • میں غلط اعلان کرنے پر اپنی ذمہ داری سے واقف ہوں۔
اس بیان کے مقاصد کے لئے، ریاستہائے متحدہ امریکہ کے تمام منحصر ممالک اور علاقوں کو امریکہ کے مرکزی علاقے کے برابر کردیا گیا ہے۔ میں اپنے اس بیان کی خلاف ورزی سے پیدا ہونے یا اس سے متعلق ہونے والے کسی بھی دعوے کے خلاف، بے ضرر آکٹا مارکیٹس انکارپوریٹڈ، اس کے ڈائریکٹرز اور افسران کا دفاع کرنے کا عہد کرتا ہوں۔
ہم آپ کی رازداری اور آپ کی ذاتی معلومات کے تحفظ کے لیے وقف ہیں۔ ہم محض اپنی پراڈکٹس اور سروسز کے متعلق خصوصی پیشکشوں اور اہم معلومات فراہم کرنے کے لیے ای میلز اکٹھا کرتے ہیں۔ اپنا ای میل ایڈریس دے کر، آپ ہم سے ایسے ای میلز وصول کرنے پر اتفاق کرتے ہیں۔ اگر آپ انسبسکرائب کرنا چاہتے ہیں یا کوئی سوالات یا خدشات ہوں تو، ہماری کسٹمر سپورٹ کو لکھیں۔
Back

AUD/JPY Price Analysis: Bulls propels pair near 105.00

  • AUD/JPY got propelled near 105.00 on Tuesday, driven by the Reserve Bank of Australia RBA's hawkish hold.
  • Tusaday's move confirms a positive short-term outlook.
  • Fundamentals may have driven the pair out of the consolidation phase seen in the last sessions.

In Tuesday's session, the AUD/JPY pair received a boost following the Reserve Bank of Australia (RBA)'s hawkish hold, with the momentum propelling the pair towards the 105.00 level. In the last sessions, price action saw a consolidation above the 104.00 level, which supported the pair now to retest cycle highs.

On the daily scale, the Relative Strength Index (RSI) stands at 62, indicating rising buying pressure and shifting into bullish territory. However, it is important to observe that the Moving Average Convergence Divergence (MACD) line is below the signal line, hinting that there is still bearish activity. Traders will need to keep an eye on a possible crossover in the upcoming sessions to confirm the continuation of Tuesday's bullish movements.

AUD/JPY daily chart
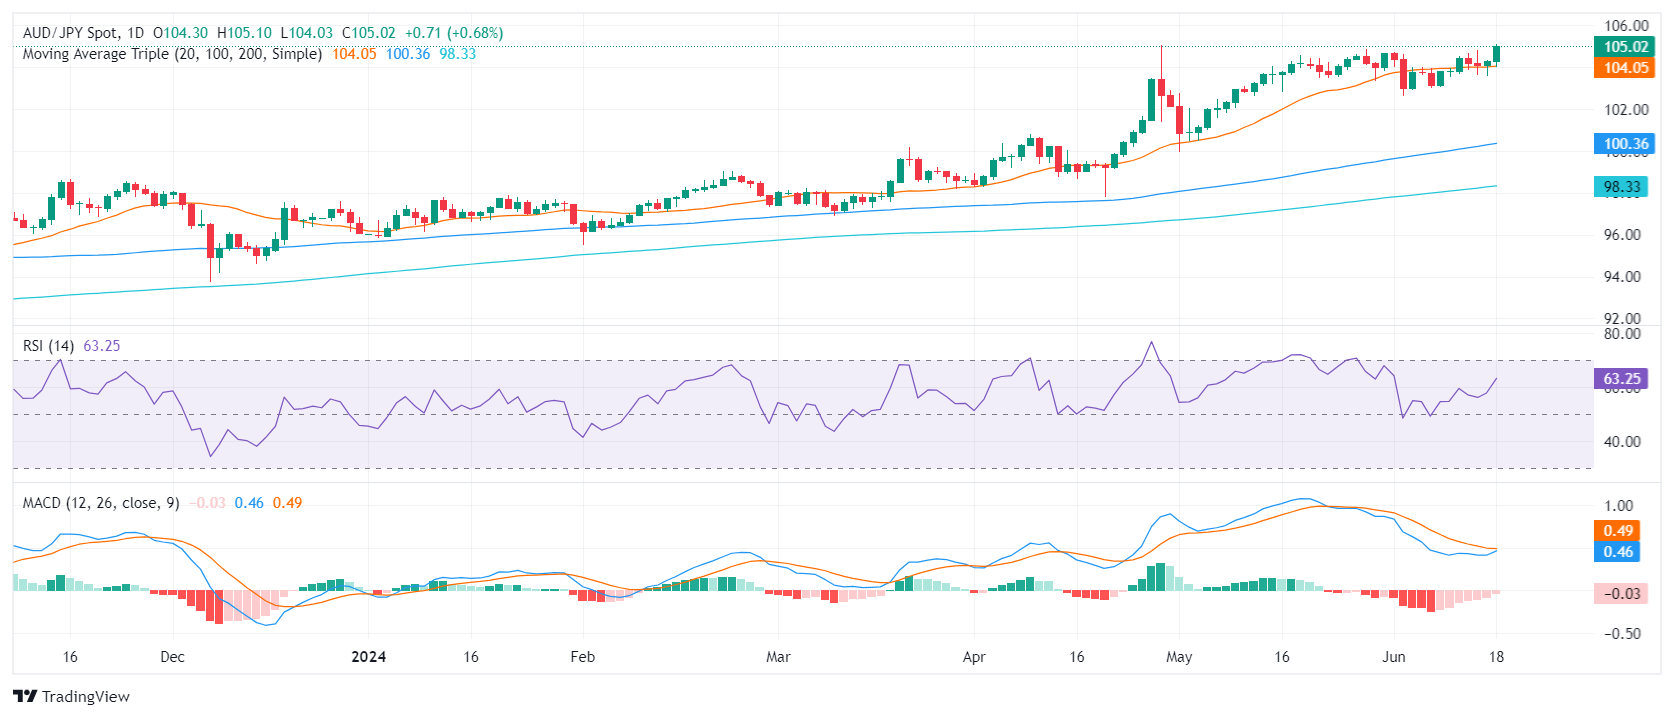
To sum it up, the AUD/JPY pair's solid performance on Tuesday supplements a broader bullish trend, with the trend's strength substantiated by the pair's value above the 20-day, 100-day, and 200-day SMAs. In the next sessions, traders can expect the pair to continue its uptrend movement within the 105.00-106.00 range as bulls have terrain to continue climbing with indicators far from overbought conditions.

On the flip side, if there is a breach below the established support level at 104.00 (20-day SMA), the pair may be prompted to find new support levels. The 102.50 and 100.35 levels are hence seen as the next potential support lines.

AUD/JPY

Overview
Today last price 105
Today Daily Change 0.69
Today Daily Change % 0.66
Today daily open 104.31
 
Trends
Daily SMA20 104.01
Daily SMA50 102.49
Daily SMA100 100.28
Daily SMA200 98.28
 
Levels
Previous Daily High 104.36
Previous Daily Low 103.59
Previous Weekly High 104.8
Previous Weekly Low 103.08
Previous Monthly High 104.87
Previous Monthly Low 99.93
Daily Fibonacci 38.2% 104.07
Daily Fibonacci 61.8% 103.88
Daily Pivot Point S1 103.81
Daily Pivot Point S2 103.32
Daily Pivot Point S3 103.05
Daily Pivot Point R1 104.58
Daily Pivot Point R2 104.85
Daily Pivot Point R3 105.34


Gold price climbs on soft US Retail Sales, igniting rate cut hopes

Gold prices rose on Tuesday after economic data from the United States (US) hinted that consumer spending is constraining due to a softer-than-estimated Retail Sales report.
مزید پڑھیں Previous

United States Net Long-Term TIC Flows above forecasts ($69B) in April: Actual ($123.1B)

United States Net Long-Term TIC Flows above forecasts ($69B) in April: Actual ($123.1B)
مزید پڑھیں Next