Back
11 Jul 2018
GBP/USD Technical Analysis: Sub-1.3300 Cable on the verge of a breakout
- GBP/USD is trading inside its the previous day’range for the second consecutive day suggesting that the market is on the verge of a breakout.
- In the broader context, GBP/USD is in a bear trend and has rejected the daily 50-period simple moving average on Monday with a strong 170-pip sell-off, suggesting that the odds are slightly tilted to the downside for the time being.
- Mark Carney, the Bank of England Governor is set to speak about the global financial crisis at the National Bureau of Economic Research conference in Boston at 15:35 GMT.
GBP/USD 15-minute chart
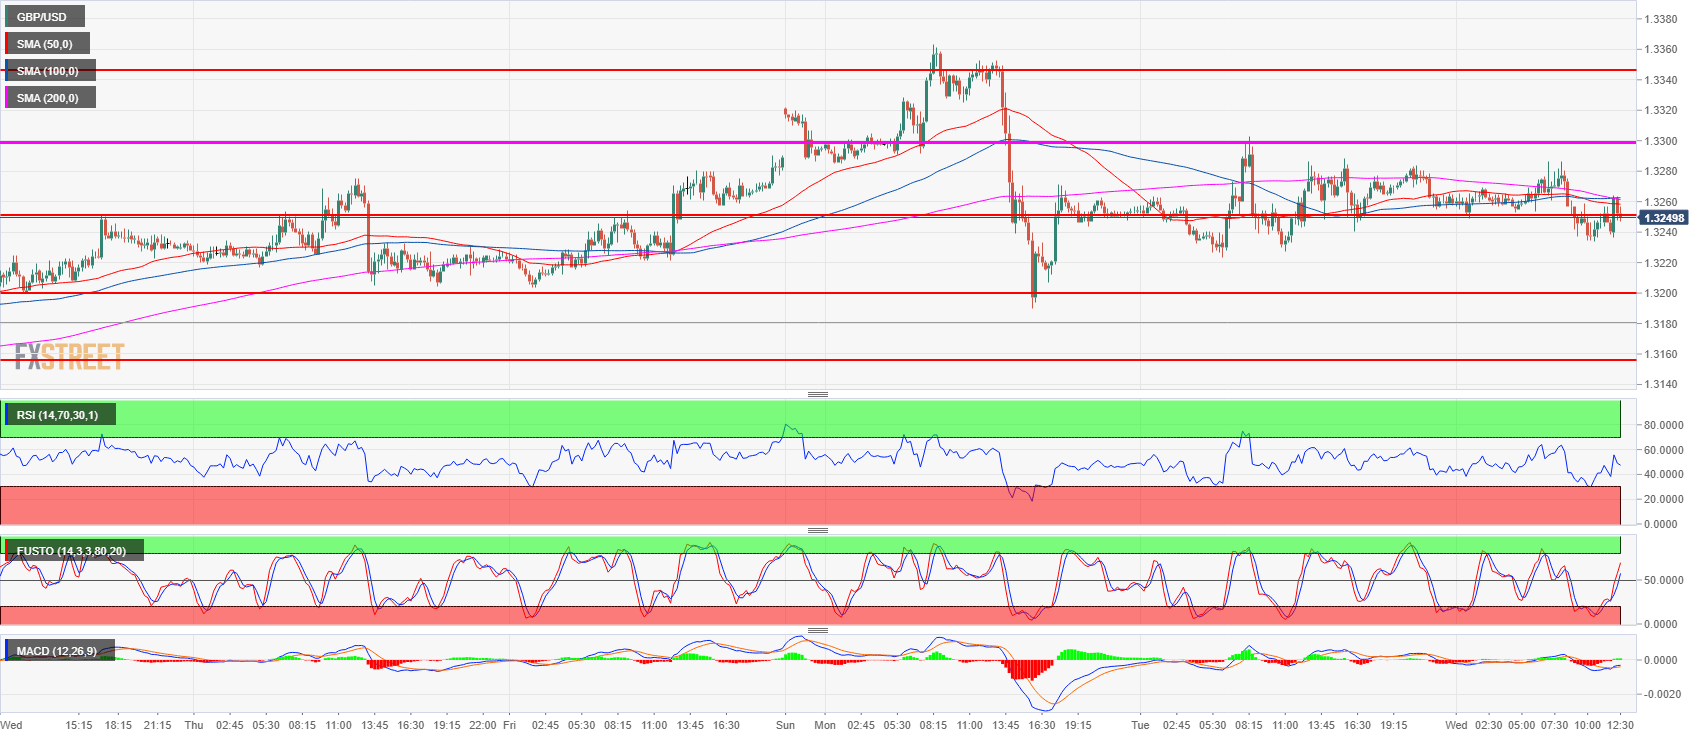
Spot rate: 1.3250
Relative change: -0.13%
High: 1.3286
Low: 1.3233
Trend: Neutral to bearish
Resistance 1: 1.3300 figure
Resistance 2: 1.3363 weekly high
Resistance 3: 1.3400 figure
Resistance 4: 1.3472 June’s high
Support 1: 1.3250 June 4 high
Support 2: 1.3200 figure
Support 3: 1.3155 former breakout point
Support 4: 1.3100 figure
Support 5: 1.3049 current 2018 low
Support 6: 1.3027 October 6, 2017 swing low