GBP/USD Technical Analysis: Cable retreating from weekly highs and breaking below 1.3200 figure
- GBP/USD is in a bull trend as the market is trading above its 200-period simple moving average on the 4-hour chart.
- GBP/USD is currently having a pullback as it is breaking below the 1.3200 figure. The RSI, MACD and Stochastic indicators are losing momentum suggesting that the pullback might extend further. Supports to the downside can be seen near 1.3150 (September 21 low) and 1.3100 figure.
- However, if bulls manage to retake 1.3200 the market is likely going to be contained within the current daily range.
GBP/USD 4-hour chart
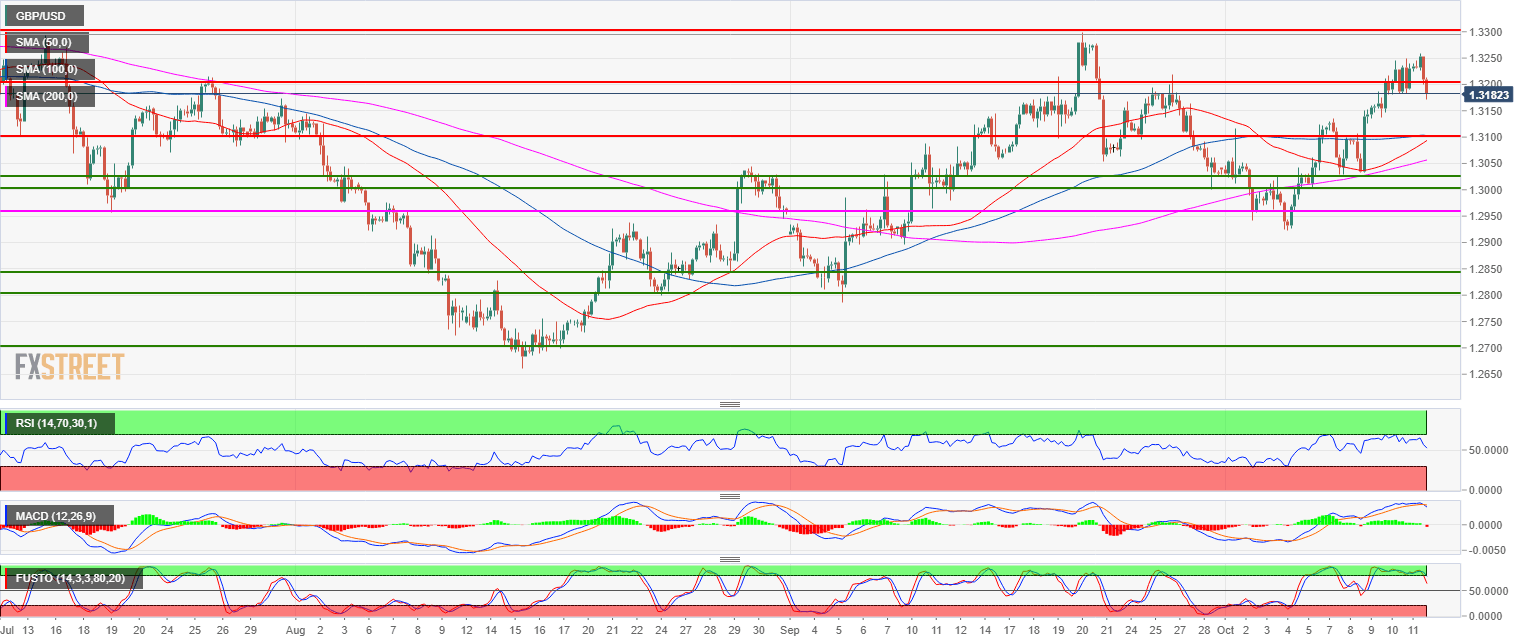
Spot rate: 1.3182
Relative change: -0.39%
High: 1.3259
Low: 1.3170
Main trend: Bullish
Resistance 1: 1.3200 figure
Resistance 2: 1.3300 September 20 high
Resistance 3: 1.3370 July 9 high
Resistance 4: 1.3400 figure
Support 1: 1.3150 September 21 low
Support 2: 1.3100 figure
Support 3: 1.3050 August 30 swing high, key level
Support 4: 1.3028 October 8 low
Support 5: 1.3000 figure
Support 6: 1.2957 July 19 swing low