GBP/USD Technical Analysis: Cable bears en route to 1.2500 figure end a new 2018 low
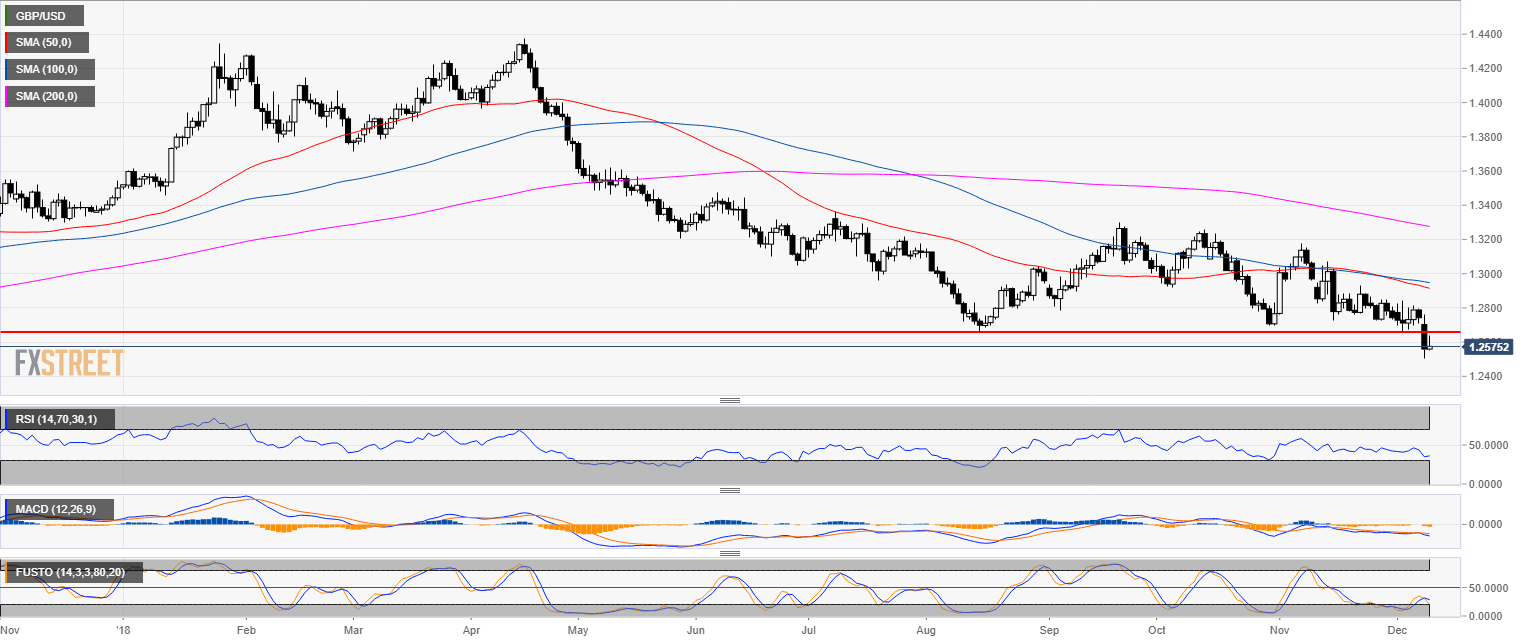
EUR/USD daily chart
- GBP/USD is trading in a bear trend below the 50, 100 and 200-day simple moving average (SMA).
- GBP/USD broke a multi-month support yesterday (Monday December 10).

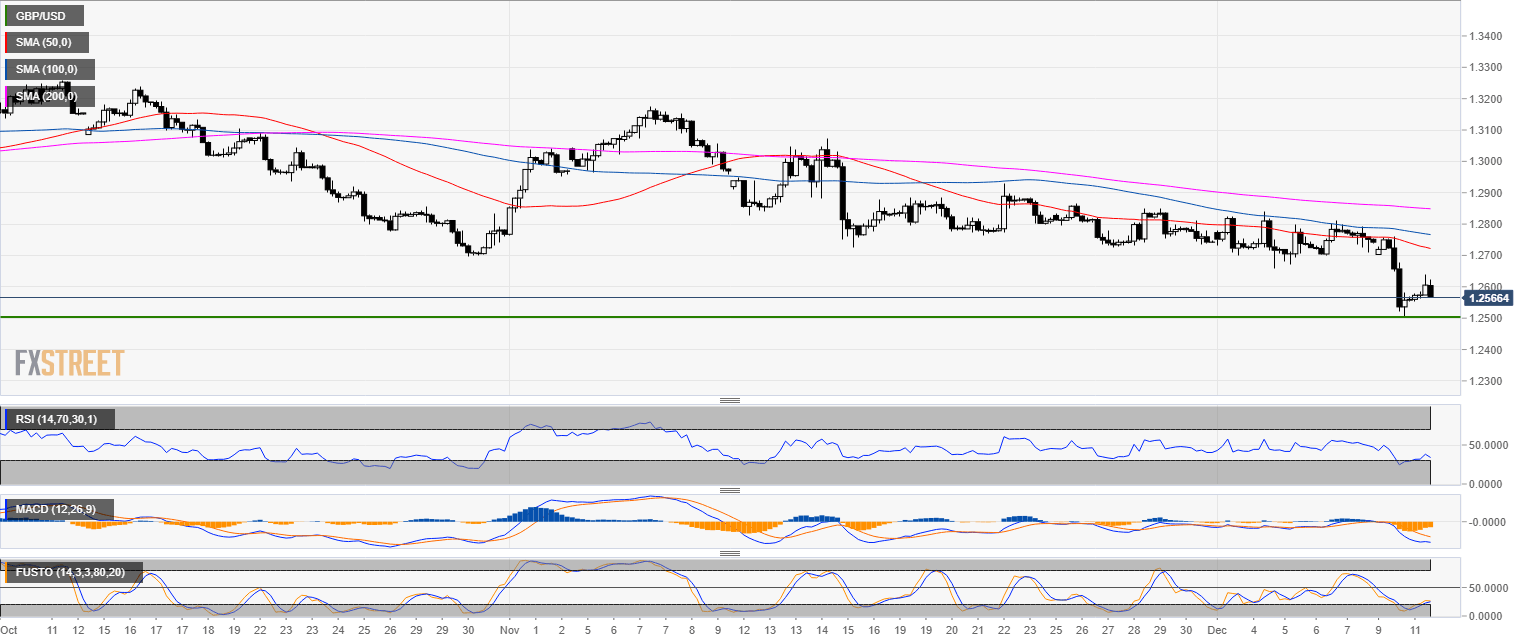
GBP/USD 4-hour chart
- GBP/USD is strongly bearish.

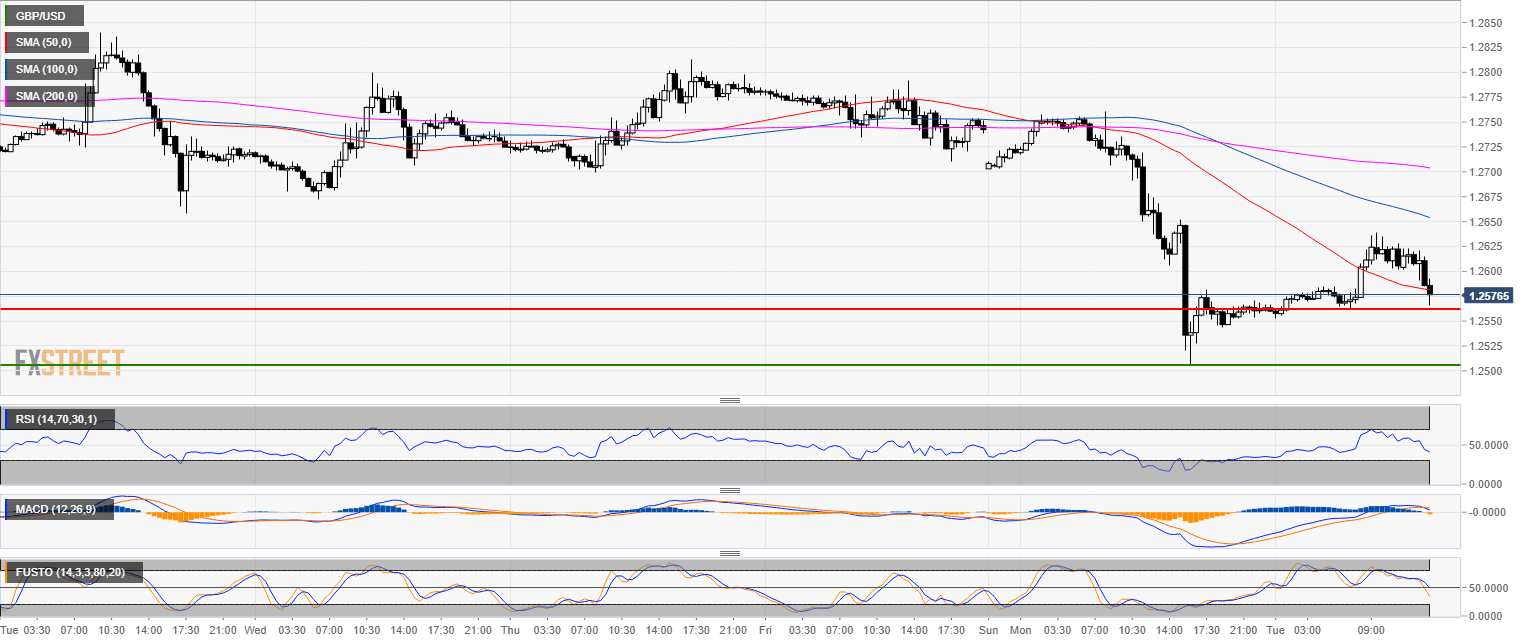
GBP/USD 30-minute chart
- The 1.2560 support is the last bastion for bears.
- If 1.2560 is broken, the 1.2500 figure is likely the next destination for Cable.

Additional key levels
GBP/USD
Overview:
Today Last Price: 1.2586
Today Daily change: 27 pips
Today Daily change %: 0.215%
Today Daily Open: 1.2559
Trends:
Previous Daily SMA20: 1.2792
Previous Daily SMA50: 1.2922
Previous Daily SMA100: 1.2953
Previous Daily SMA200: 1.3281
Levels:
Previous Daily High: 1.276
Previous Daily Low: 1.2507
Previous Weekly High: 1.284
Previous Weekly Low: 1.2659
Previous Monthly High: 1.3176
Previous Monthly Low: 1.2723
Previous Daily Fibonacci 38.2%: 1.2604
Previous Daily Fibonacci 61.8%: 1.2663
Previous Daily Pivot Point S1: 1.2457
Previous Daily Pivot Point S2: 1.2355
Previous Daily Pivot Point S3: 1.2204
Previous Daily Pivot Point R1: 1.2711
Previous Daily Pivot Point R2: 1.2862
Previous Daily Pivot Point R3: 1.2964
