EUR/USD Technical Analysis: Euro advancing towards 1.1400 figure post-US CPI
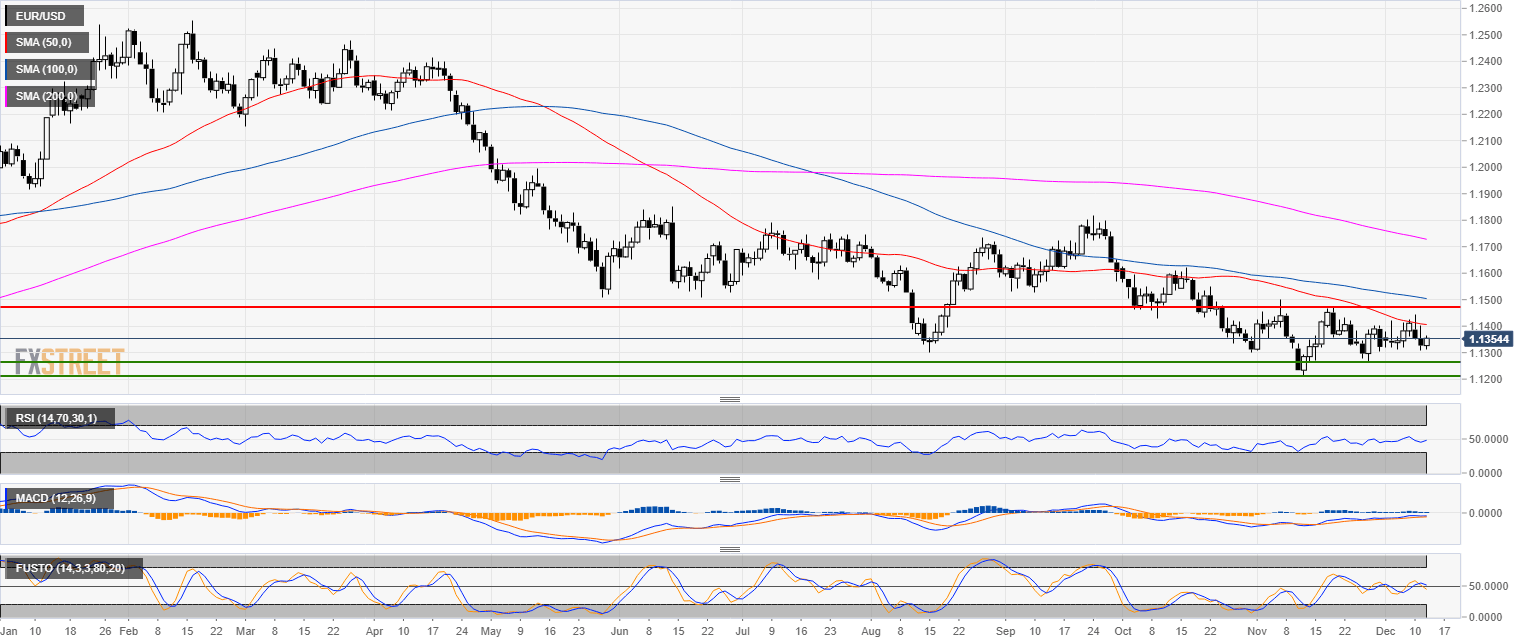
EUR/USD daily chart
- EUR/USD is trading in a bear trend below the 50, 100 and 200-day simple moving average (SMA).
- The Core US Consumer Price Index y/y for November came in at 2.2% in line with market expectations.
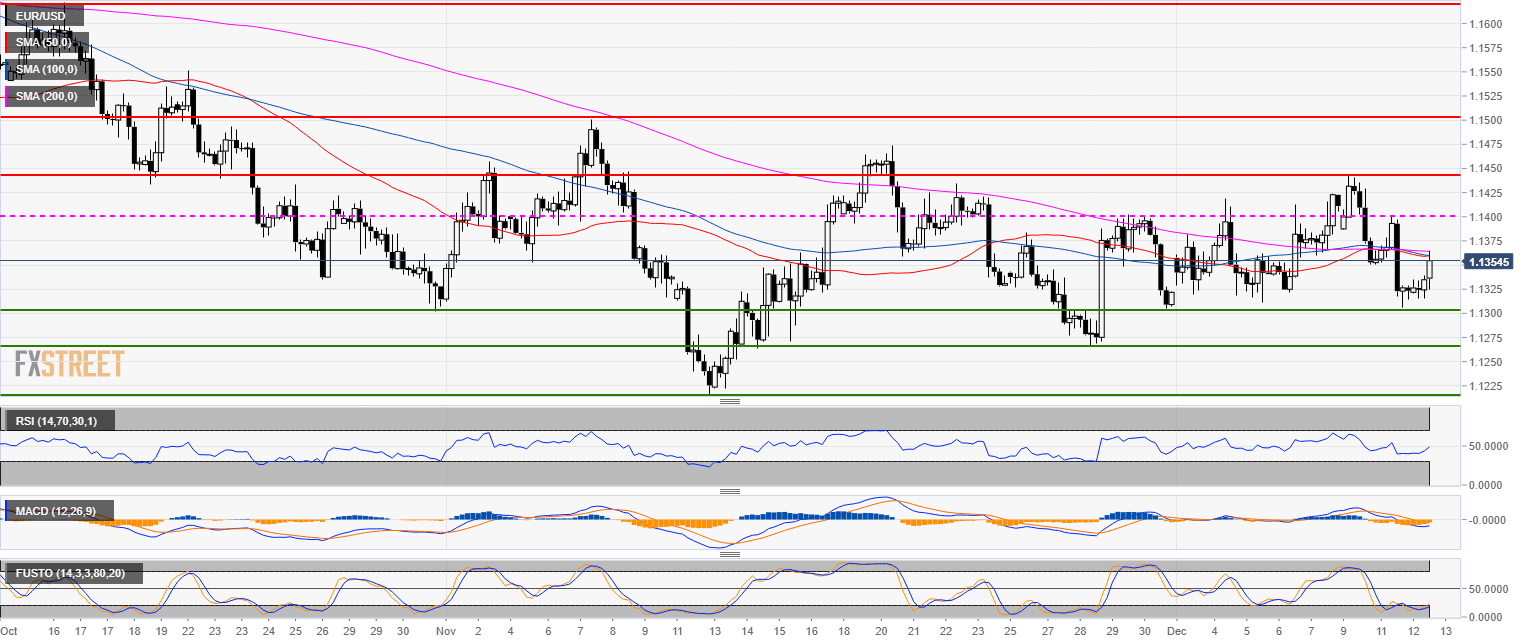
EUR/USD 4-hour chart
- EUR/USD is testing the main SMAs near 1.1350.
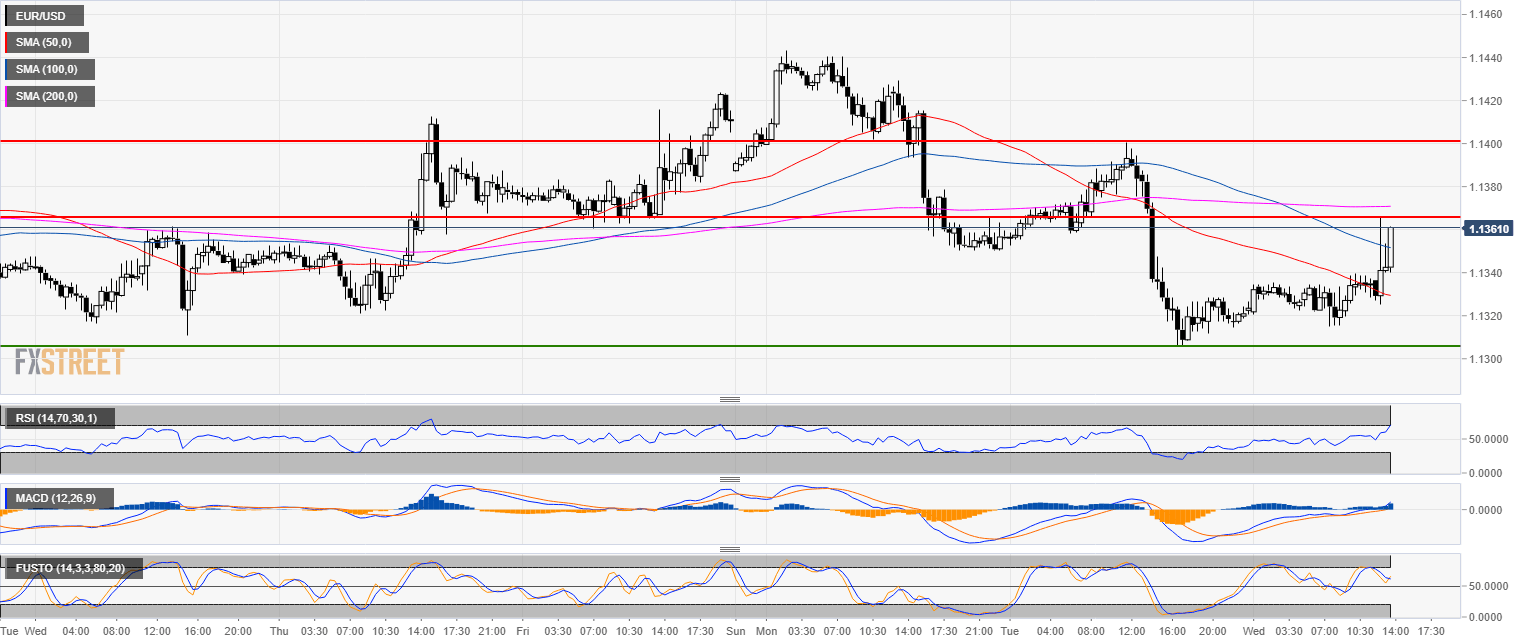
EUR/USD 30-minute chart
- EUR/USD regained the downward sloping 50 and 100 SMA.
- The 1.1365 level and the 200 SMA are the resistances that bulls will need to overcome.
- A break of 1.1365 can lead to an advance to 1.1400 figure.
Additional key levels
EUR/USD
Overview:
Today Last Price: 1.1353
Today Daily change: 25 pips
Today Daily change %: 0.221%
Today Daily Open: 1.1328
Trends:
Previous Daily SMA20: 1.1361
Previous Daily SMA50: 1.1409
Previous Daily SMA100: 1.1508
Previous Daily SMA200: 1.1733
Levels:
Previous Daily High: 1.14
Previous Daily Low: 1.1306
Previous Weekly High: 1.1424
Previous Weekly Low: 1.1311
Previous Monthly High: 1.15
Previous Monthly Low: 1.1216
Previous Daily Fibonacci 38.2%: 1.1342
Previous Daily Fibonacci 61.8%: 1.1365
Previous Daily Pivot Point S1: 1.1289
Previous Daily Pivot Point S2: 1.1251
Previous Daily Pivot Point S3: 1.1195
Previous Daily Pivot Point R1: 1.1383
Previous Daily Pivot Point R2: 1.1439
Previous Daily Pivot Point R3: 1.1477