Back
15 Feb 2019
NZD/USD Technical Analysis: Failure to cross 0.6850 signals 0.6790 comeback
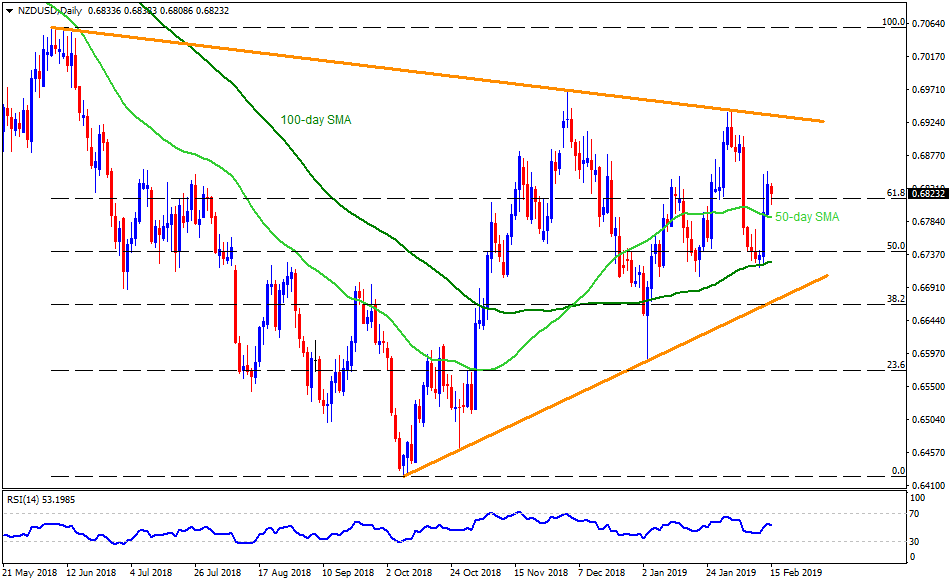
NZD/USD daily chart
- The NZD/USD pair refrained to extend prior gains beyond 0.6850 and trades near 0.6820 during early Friday.
- The pair has been trailing behind 0.6850 since last three days and weaker than expected China CPI portrayed one such pullback early today.
- As a result, prices may come back to 50-day simple moving average (SMA), at 0.6790 whereas 0.6770 and 100-day SMA level of 0.6725 could confine the pair’s downside afterward.
- In case the quote closes under 0.6725, an upward sloping trend-line connecting lows marked since October 2018, at 0.6665 might flash on Bears’ radar.
- Alternatively, an upside clearance of 0.6850 can propel the pair towards last-week’s high near 0.6905 while descending resistance line, at 0.6935 could challenge upside then after.
- If at all there prevail additional increase beyond 0.6935, 0.6975 and 0.7000 could lure the buyers.
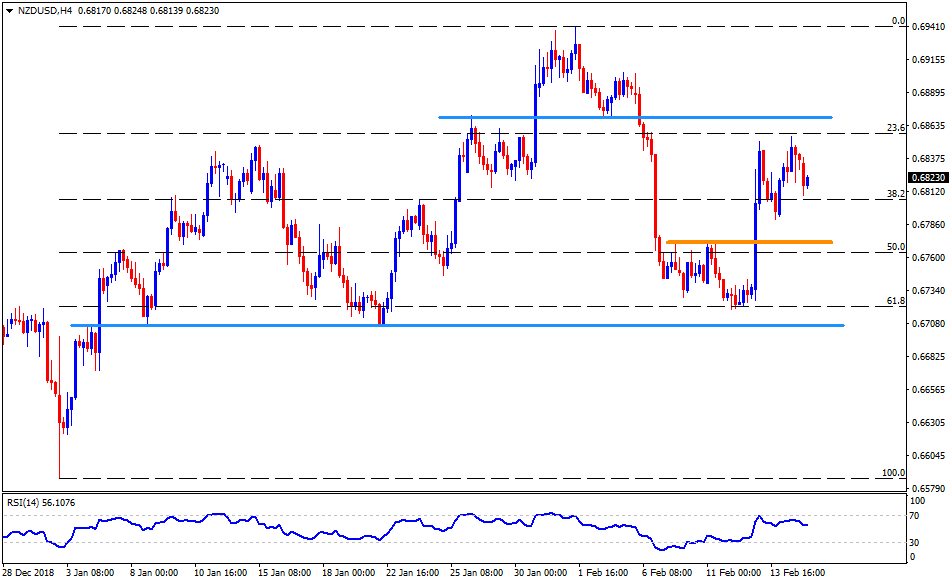
NZD/USD 4-Hour chart
- Observing H4 chart, it can be known that the 0.6705 may try to limit the pair’s decline after 0.6725, if not then 0.6665 and 0.6620 can play their role as support.
- Meanwhile, the 0.6870 horizontal-line may offer an intermediate stop to the price rise past-0.6850 towards 0.6905.
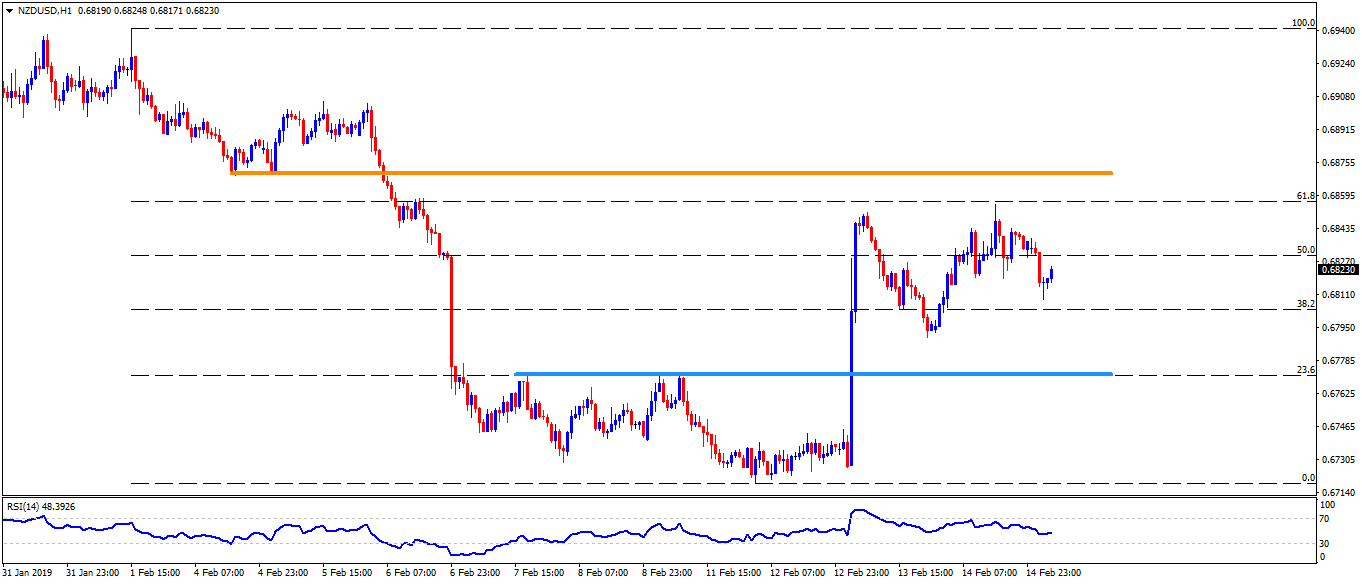
NZD/USD hourly chart
- 0.6770 and 0.6870 appear more clearly on H1 with 0.6790 and 0.6850 being intermediate halts during the move.
- Also, 0.6735 can offer rest to the pair after 0.6770 and before 0.6725.