EUR/GBP technical analysis: Euro finding some support near 0.8880 - Can it last?
- EUR/GBP dropped to daily lows near 0.8880 support.
- Can the bulls lift the market to 0.8910 resistance?
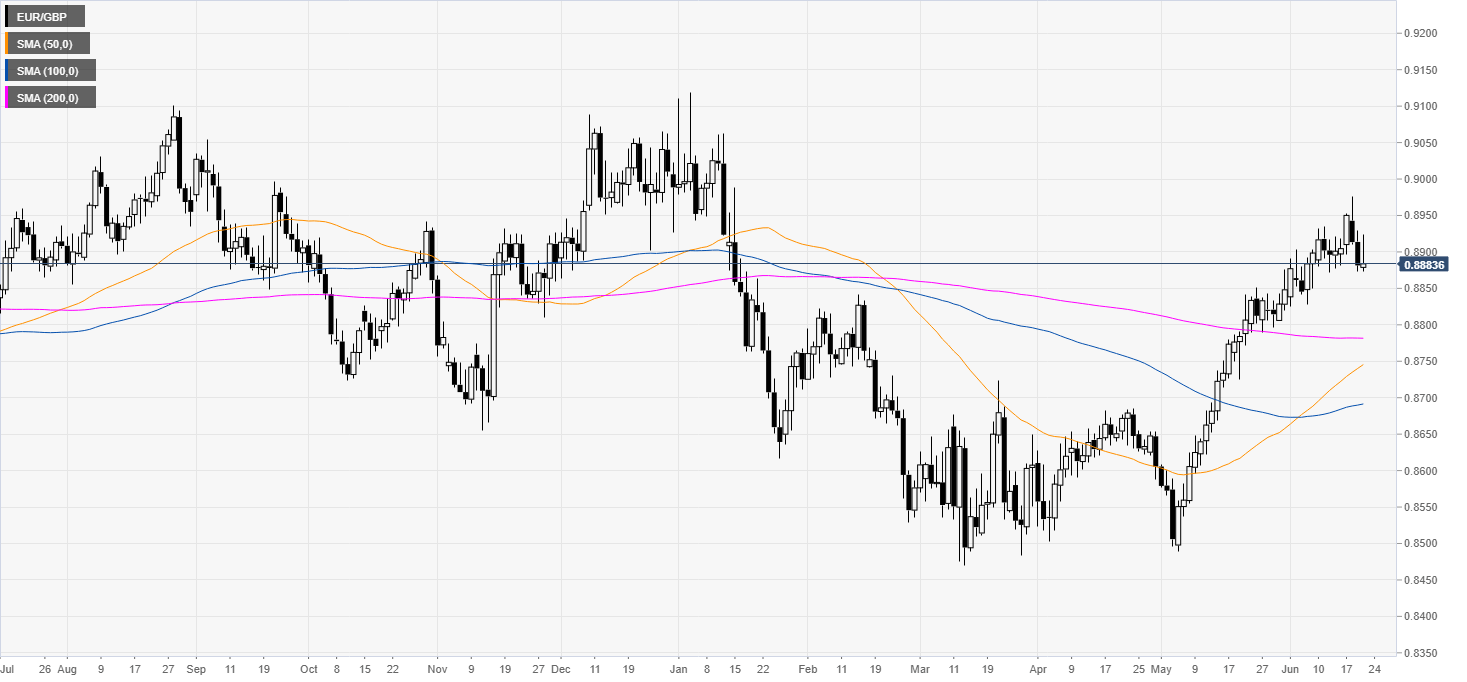
EUR/GBP daily chart
EUR/GBP is in a bull leg above its main simple moving averages (SMAs). The market attempted to break above Wednesday high but is currently under pressure below 0.8900 figure.

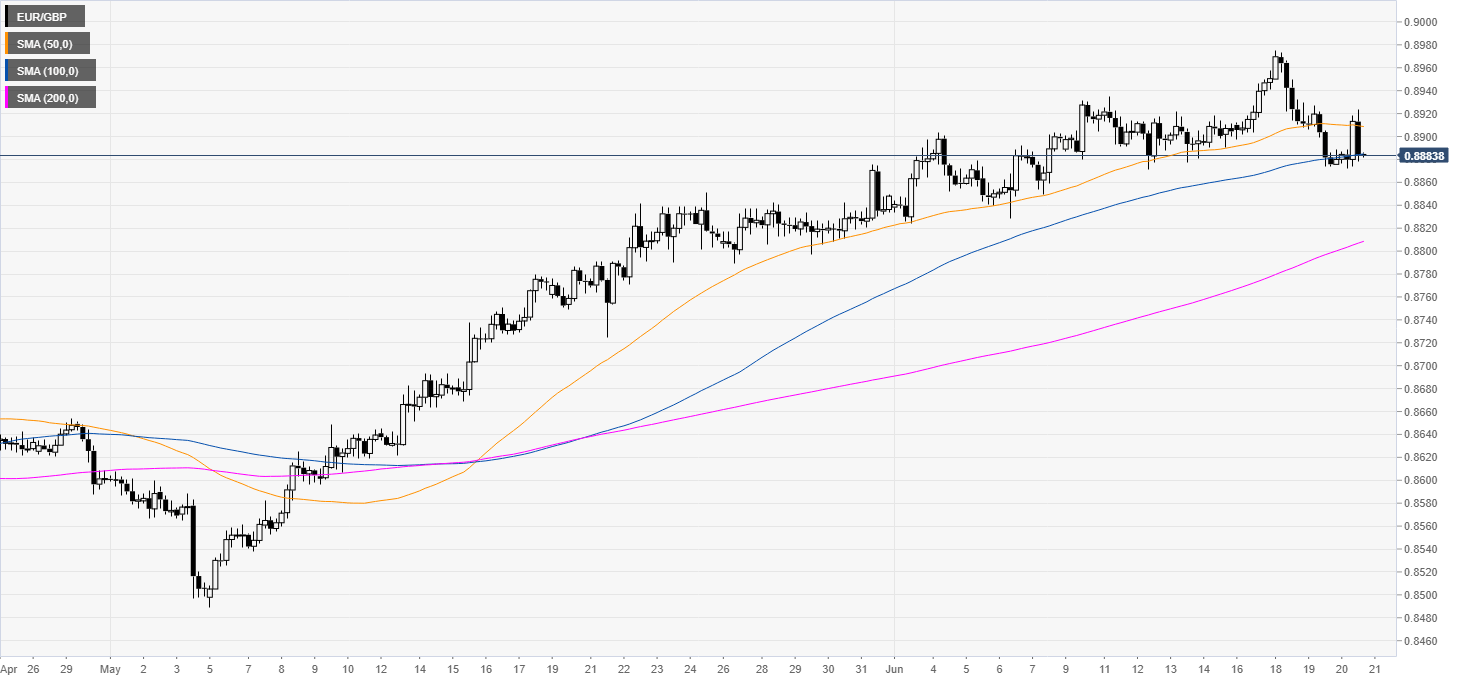
EUR/GBP 4-hour chart
The trend is slowing down as the market is trading below the 50 SMA and is challenging the 100 SMA.

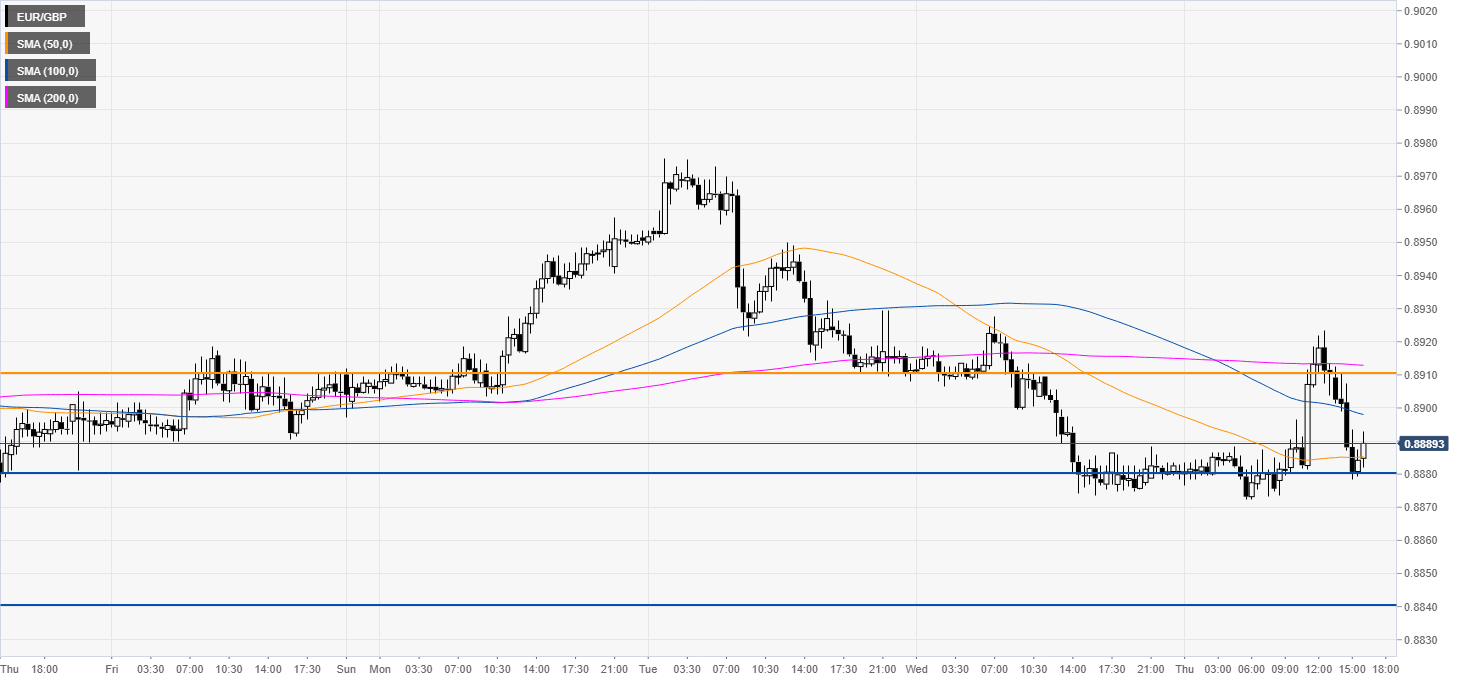
EUR/GBP 30-minute chart
EUR/GBP is trading below its 100 and 200 SMAs suggesting potential bearish momentum. EUR/GBP found strong support near 0.8870/80 which is a cluster of technical levels according to the Technical Confluences Indicator. If the bears break this support the next level in line is seen at 0.8843 ( daily an weekly pivot point cluster). On the flip side, if the market finds some footing above 0.8880 EUR/GBP could rebound to 0.8910 resistance (technical levels cluster). Further up, lies 0.8935 resistance (previous week high and Wednesday high).

Additional key levels
