Back
19 Jul 2019
US Dollar Index technical analysis: DXY recovers on Friday as bulls lift the matket above the 97.00 handle
- DXY erased Thursday’s losses and regained the 97.00 handle.
- The level to beat for bulls are at 97.30 and 97.55.
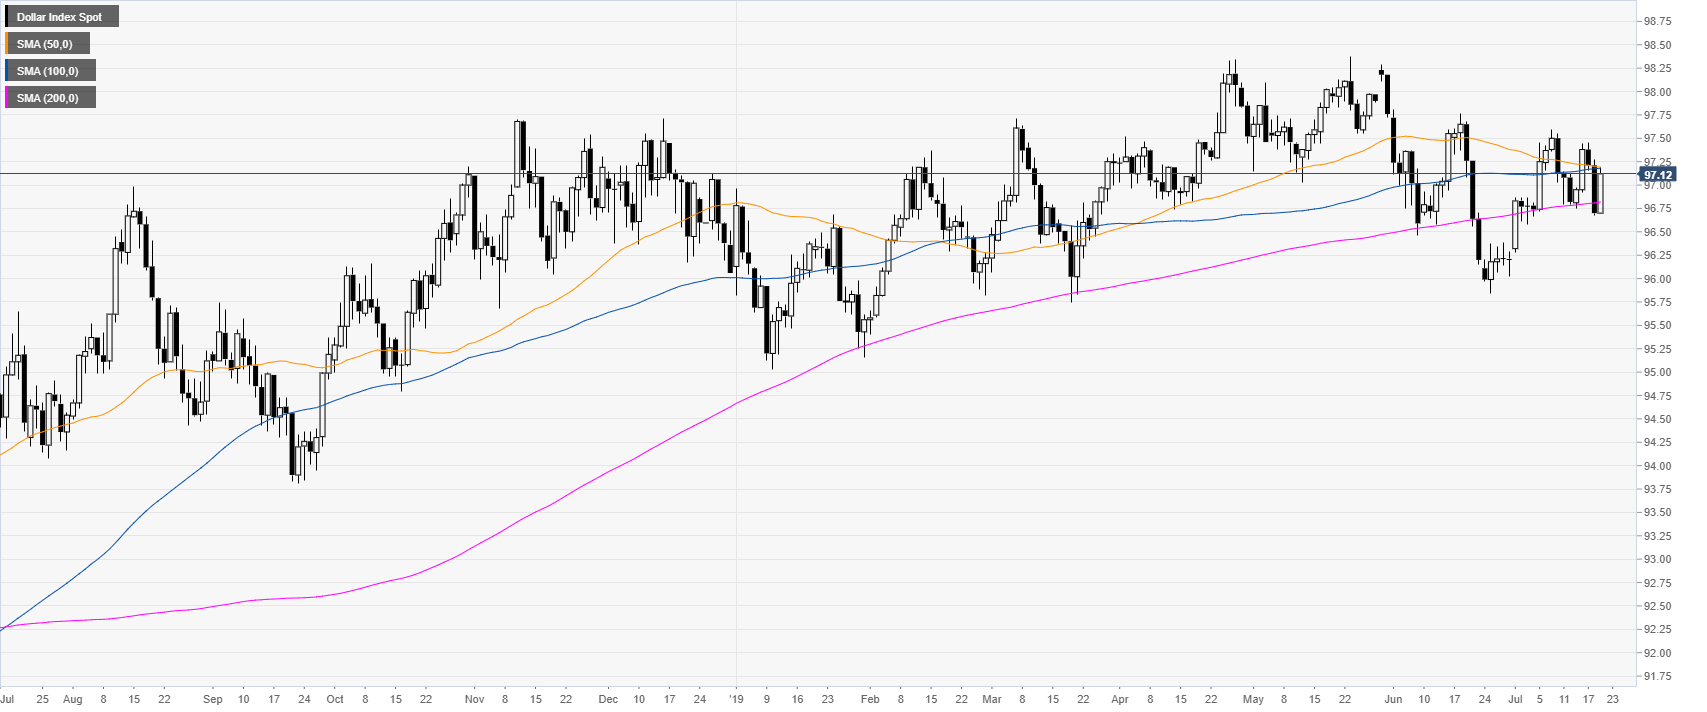
DXY daily chart
The US Dollar Index (DXY) rebouned near the 200-daily simple moving average (DSMA) as the market is trading above the 97.00 handle. The market is finding resistance near 97.15 where lie the 50 and 100 DSMAs.
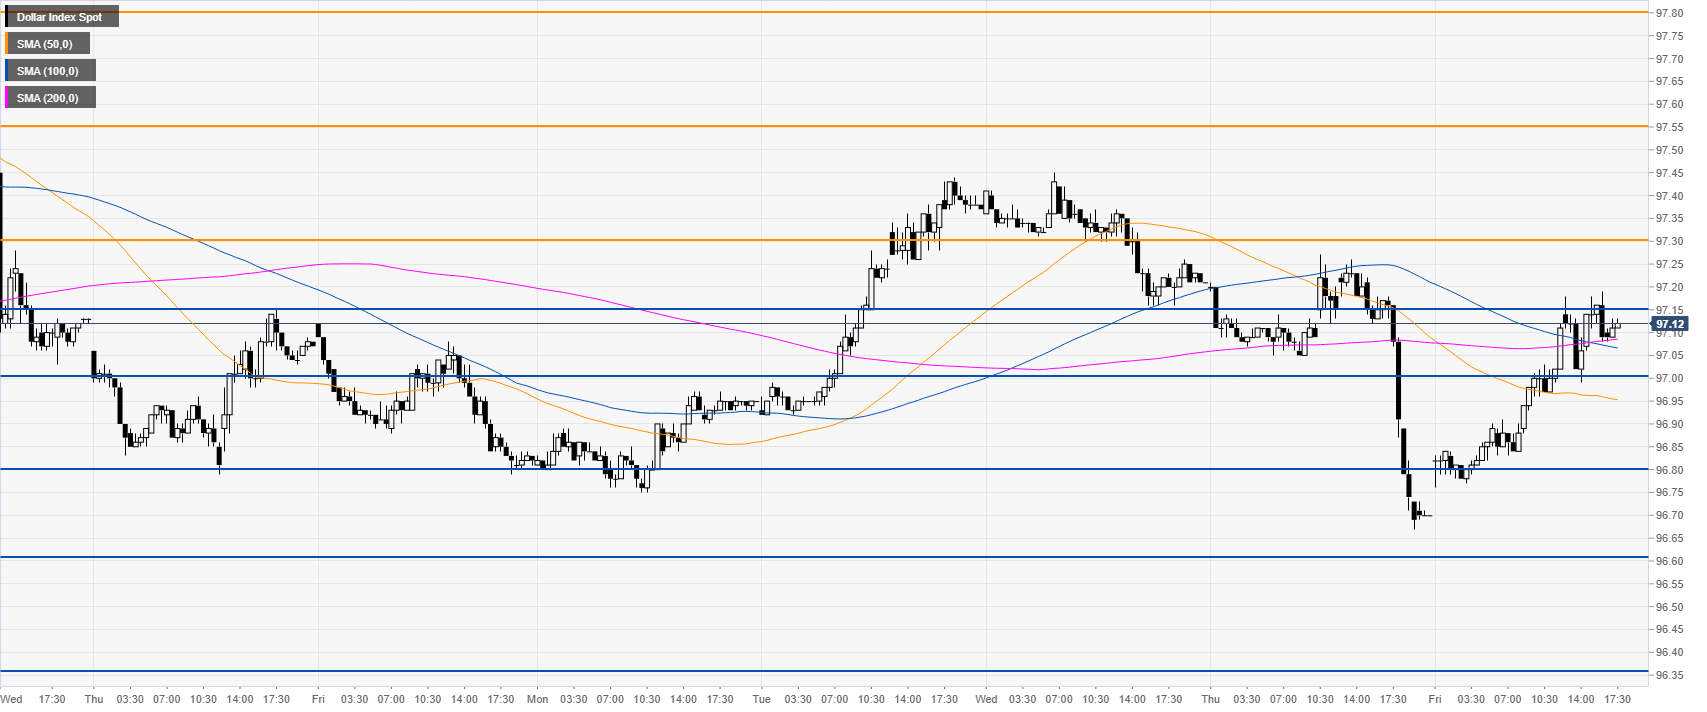
DXY 4-hour chart
DXY is challenging the 90.15 resistance as it is trading above its main SMAs. 97.30 and the 97.55 resistances are the main hurdles to the upside.

DXY 30-minute chart
The market is trading above its main SMAs suggesting bullish momentum in the near term. Immediate support is seen at the 97.00 and 96.80 level.
Additional key levels