Back
18 Oct 2019
USD/IDR technical analysis: Lacks momentum inside two-month-old triangle
- USD/IDR continues in a choppy range inside the near-term symmetrical triangle.
- 38.2% Fibonacci retracement level, formation support becomes the key for now.
Despite the USD/IDR pair’s recent U-turn from 50% Fibonacci retracement, it stays inside a multi-week long symmetrical triangle while taking rounds to 14,140 during early Friday.
Sellers await a clear break of 14,115, comprising pattern’s support and 38.2% Fibonacci retracement of April-June downpour, in order to aim for 14,000.
However, 13,880 might question bears during further weakness, if not then June low nearing 13,750 will be on their radar.
On the upside, 50% Fibonacci retracement level of 14,230 acts as an immediate resistance ahead of the upper line of the triangle, at 14,250.
Should prices clear 14,250, 61.8% Fibonacci retracement near 14,345, followed by 14,420 could lure buyers.
USD/IDR daily chart
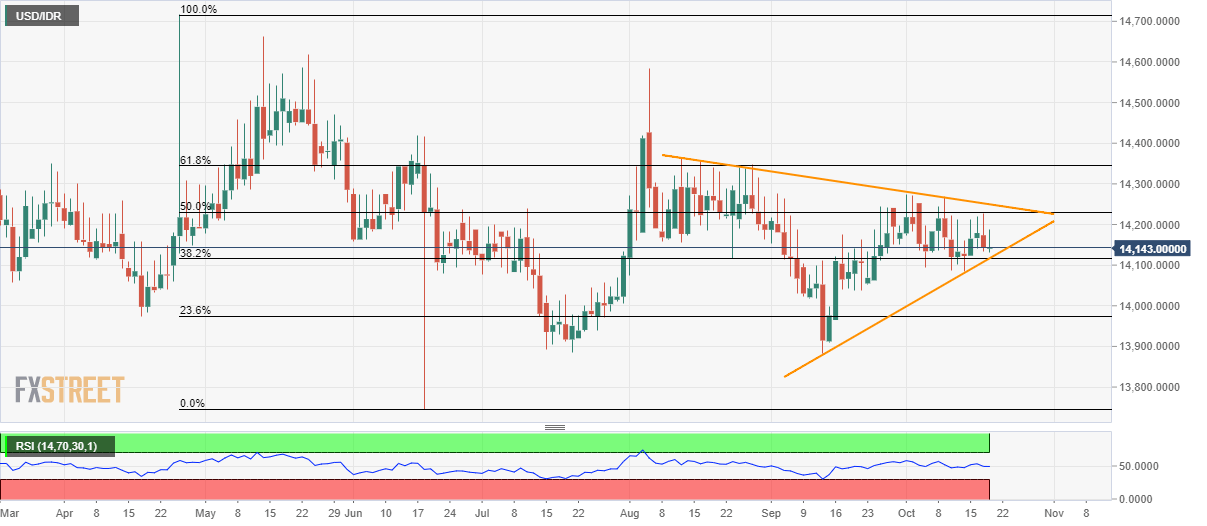
Trend: sideways