Back
23 Oct 2019
USD/CAD technical analysis: Bounces off 1-year-old rising trendline towards 61.8% Fibo.
- USD/CAD pulls back from three-month low amid oversold RSI conditions.
- 61.8% Fibonacci retracement holds the key for the pair’s further recovery.
- July lows will be on the sellers’ radar during further declines.
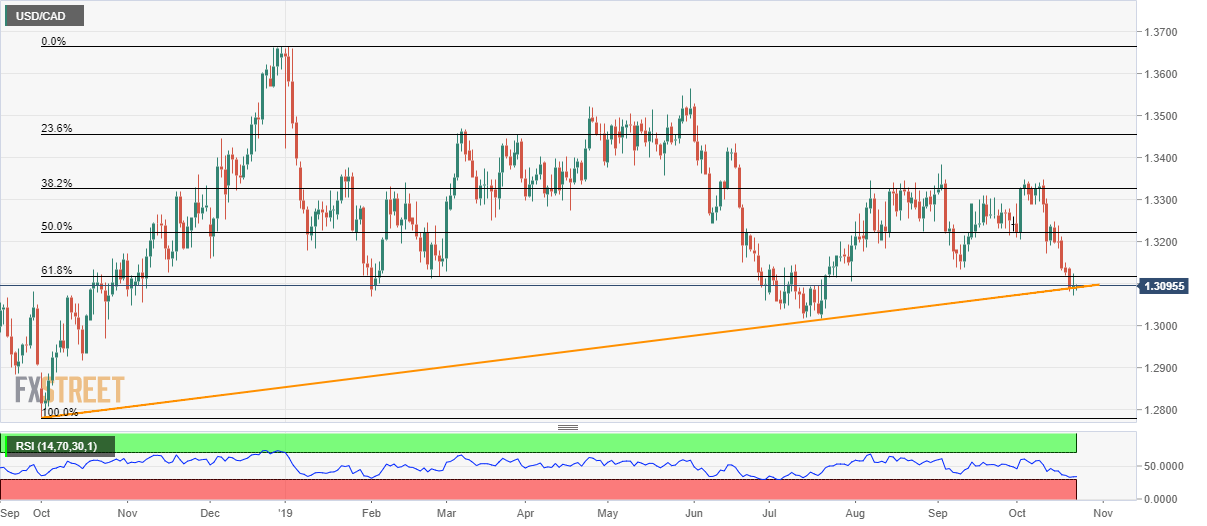
Having recovered from a three-month low, USD/CAD clings to the yearly support line while taking rounds to 1.3090 during the Asian session on Wednesday.
Supporting the recovery is oversold conditions of 14-bar Relative Strength Index (RSI), which in turn questions the strength of 61.8% Fibonacci retracement of late-2018 upside, around 1.3120.
Though, pair’s sustained rise past-1.3120 enables it to question September 10 low near 1.3135 before targeting 1.3170/75 resistance area.
Alternatively, pair’s declines below medium-term trend line support, at 1.3190 now, can recall July lows nearing 1.3015 back to the charts
USD/CAD daily chart

Trend: pullback expected
