Back
19 Dec 2019
EUR/USD Price Analysis: Euro starting to breakdown below 200 DMA
- EUR/USD bulls are losing considerable strength below the 200 DMA.
- The level to beat for bears is the 1.1102 support.
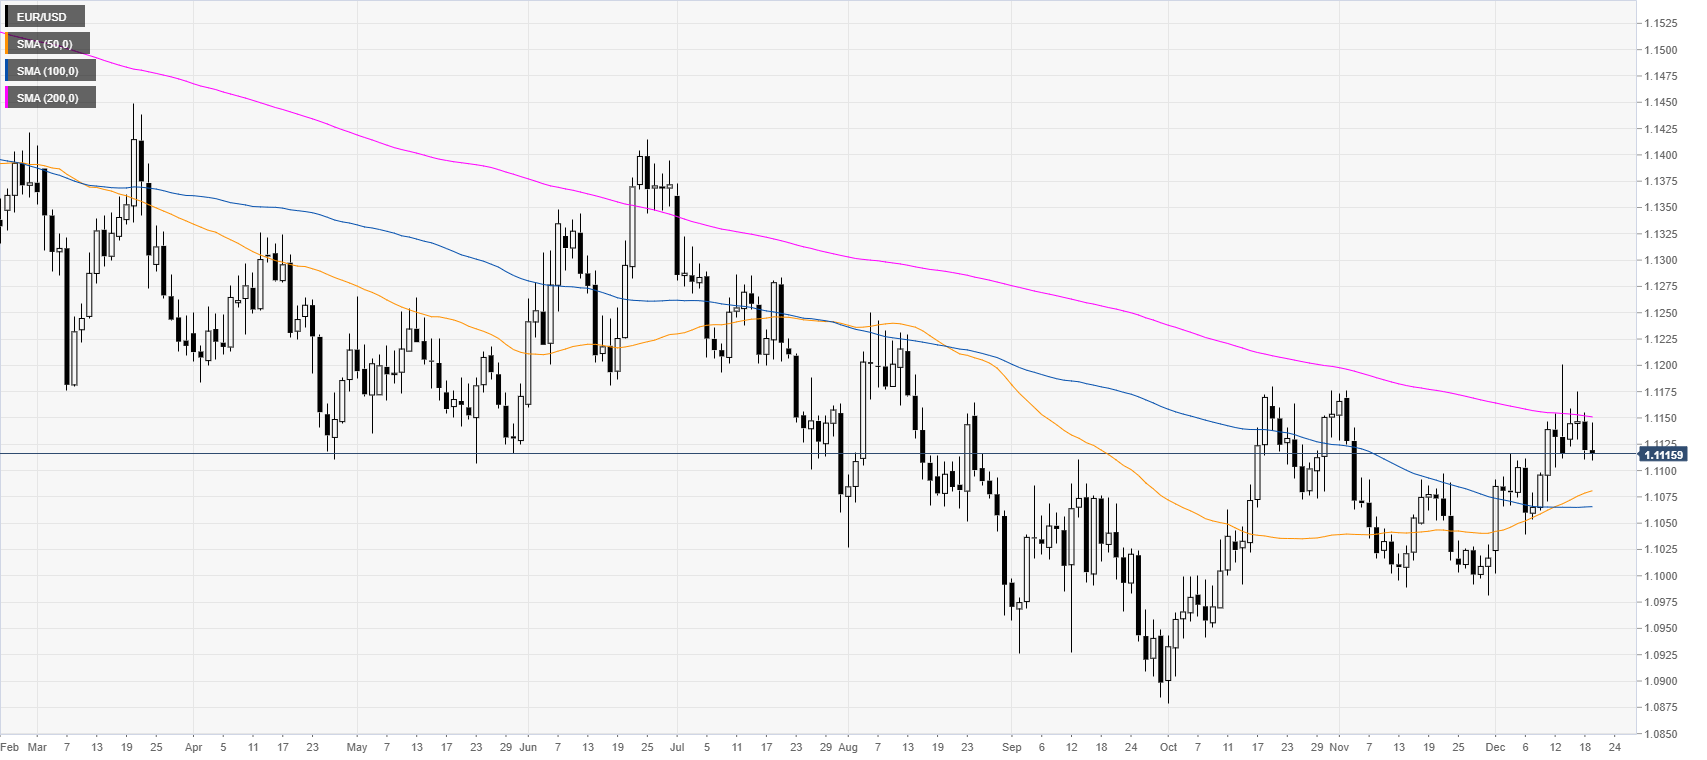
EUR/USD daily chart
The market is showing signs of weakness below the 1.1183/1.1200 resistance zone and the 200-day simple moving average (DMA).
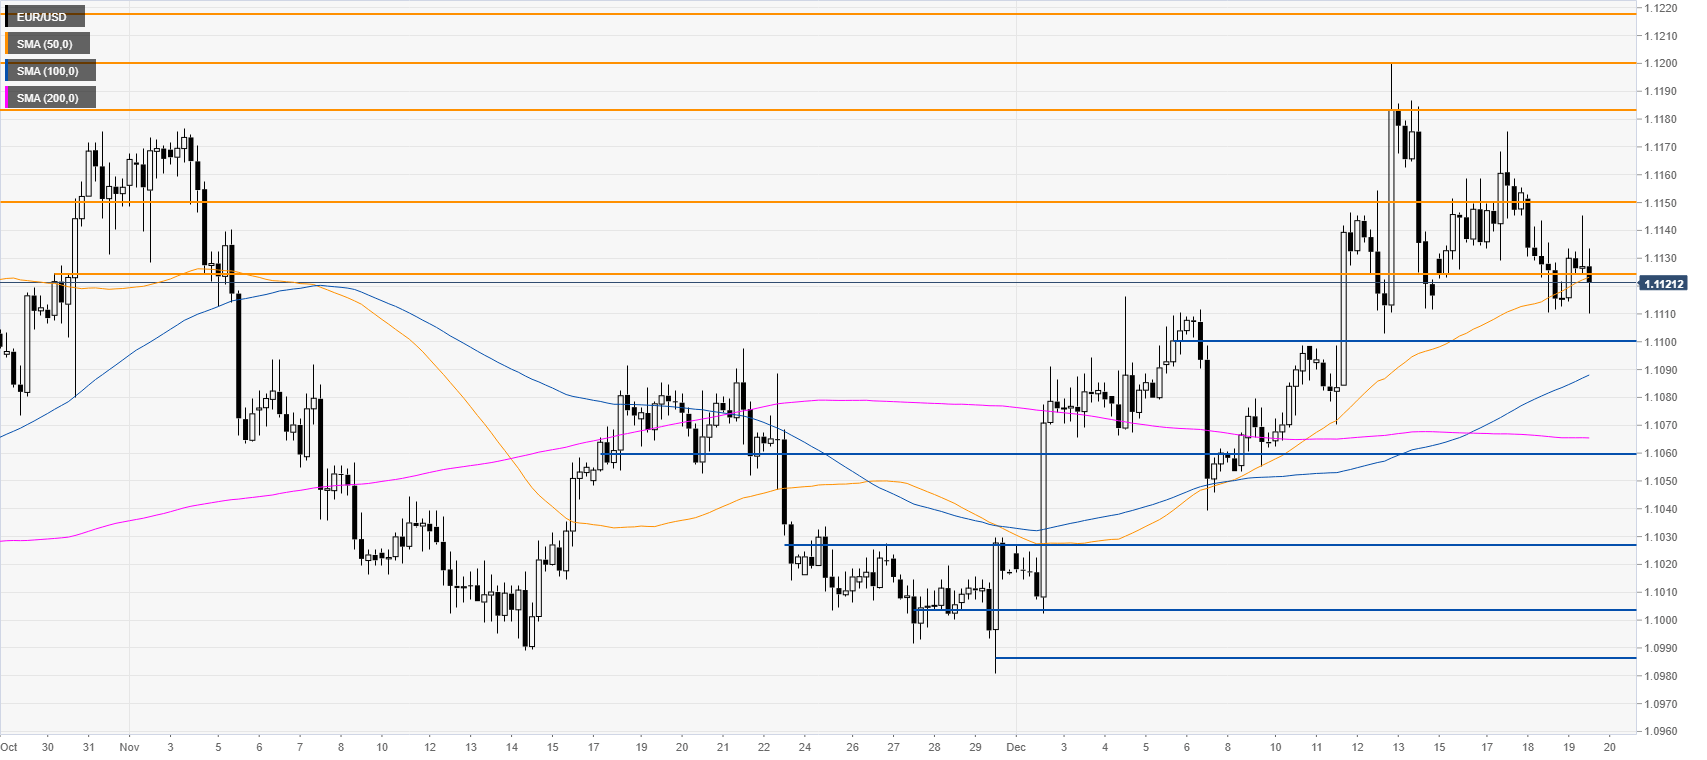
EUR/USD four-hour chart
The head-and-shoulders pattern is putting the euro under pressure. Sellers broke below the 1.1125 level and the 50 SMA on the four-hour chart. As the market is weakening, a break below the 1.1102 support can lead to further declines towards the 1.1060 level, according to the Technical Confluences Indicator. Meanwhile, resistance is seen at 1.1125, 1.1150 and 1.1183/1.1200 price zone.
Additional key levels