Confirming you are not from the U.S. or the Philippines

یہ بیان دے کر، میں واضح طور پر یہ بتاتا اور تصدیق کرتا ہوں کہ:
  • میں امریکی شہری یا رہائشی نہیں ہوں
  • میں فلپائن کا رہائشی نہیں ہوں
  • میں بالواسطہ یا بلاواسطہ امریکی باشندوں کے 10 فیصد سے زیادہ شیئرز/ ووٹنگ کا حق/ امریکی باشندوں کے انٹرسٹ کا مالک نہیں ہوں اور/یا دوسرے ذرائع سے امریکی شہریوں یا رہائشیوں کو کنٹرول نہیں کرتا ہوں۔
  • میں بالواسطہ یا بلاواسطہ امریکی باشندوں کے 10 فیصد سے زیادہ شیئرز/ ووٹنگ کا حق/ انٹرسٹ کا مالک نہیں ہوں اور/ یا کسی دوسرے ذریعے سے امریکی شہری یا رہائشی کے کنٹرول میں نہیں ہوں۔
  • میں FATCA کے سیکشن (a)1504 کے معاملے میں امریکی شہریوں یا رہائشیوں کے ساتھ وابستہ نہیں ہوں
  • میں غلط اعلان کرنے پر اپنی ذمہ داری سے واقف ہوں۔
اس بیان کے مقاصد کے لئے، ریاستہائے متحدہ امریکہ کے تمام منحصر ممالک اور علاقوں کو امریکہ کے مرکزی علاقے کے برابر کردیا گیا ہے۔ میں اپنے اس بیان کی خلاف ورزی سے پیدا ہونے یا اس سے متعلق ہونے والے کسی بھی دعوے کے خلاف، بے ضرر آکٹا مارکیٹس انکارپوریٹڈ، اس کے ڈائریکٹرز اور افسران کا دفاع کرنے کا عہد کرتا ہوں۔
ہم آپ کی رازداری اور آپ کی ذاتی معلومات کے تحفظ کے لیے وقف ہیں۔ ہم محض اپنی پراڈکٹس اور سروسز کے متعلق خصوصی پیشکشوں اور اہم معلومات فراہم کرنے کے لیے ای میلز اکٹھا کرتے ہیں۔ اپنا ای میل ایڈریس دے کر، آپ ہم سے ایسے ای میلز وصول کرنے پر اتفاق کرتے ہیں۔ اگر آپ انسبسکرائب کرنا چاہتے ہیں یا کوئی سوالات یا خدشات ہوں تو، ہماری کسٹمر سپورٹ کو لکھیں۔
Octa trading broker
ٹریڈنگ اکاؤنٹ کھولیں
Back

NZD/USD Price Analysis: Bears aim for five-week low of 0.6554

  • NZD/USD extends losses below 200-bar SMA, 61.8% Fibonacci retracement.
  • The previous week’s top will limit near-term recovery, December 11 low can please bears during further weakness.

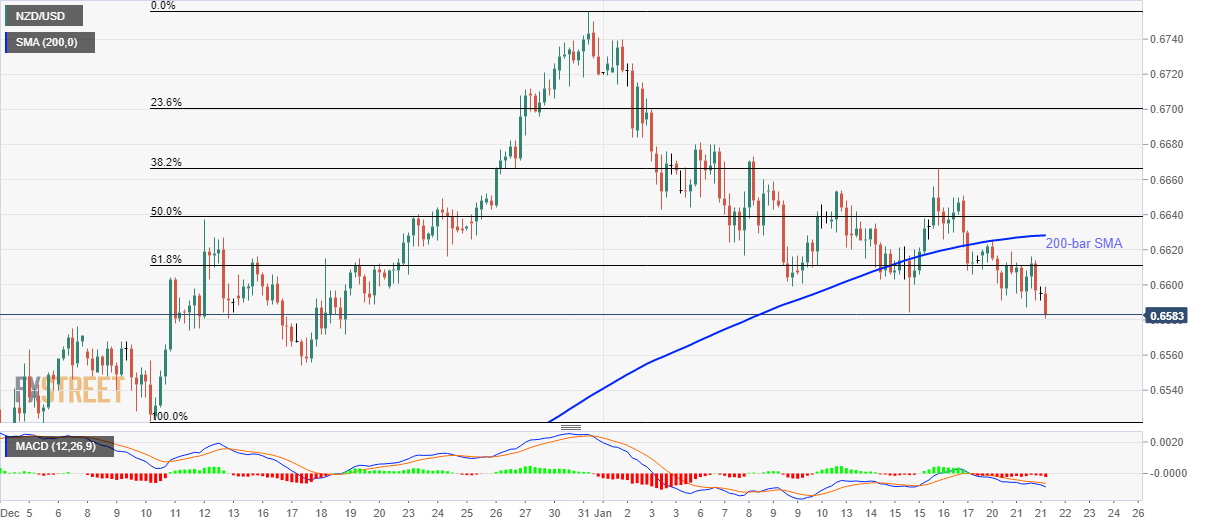
NZD/USD stretches losses to monthly of 0.6581 by the press time of early Wednesday. The pair remains on the back foot below 200-bar SMA and 61.8% Fibonacci retracement of its run-up from December 11 to 31. Also supporting the sellers are bearish MACD signals.

As a result, December 18 low near 0.6554 is likely arriving on the chart whereas December 11 bottom close to 0.6520 can mark its presence afterward.

If at all the NZD/USD prices fail to bounce off 0.6520, a 200-day SMA level near 0.6513 can offer another chance which if ignored can recall sub-0.6500 area back to the charts.

On the upside, 61.8% Fibonacci retracement around 0.6610 and 200-bar SMA level of 0.6630 can challenge the pair’s short-term pullbacks ahead of the previous week’s high close to 0.6670.

During the pair’s recovery beyond 0.6670, the 0.6682 and 0.6700 will gain the buyers’ attention.

NZD/USD four-hour chart

Trend: Bearish


Majority of fund mangers expect Treasury yield curve to steepen - BoAML survey

A majority of fund managers expect the Treasury curve, as represented by the 10-year yield, to steepen, although the number of respondents saying this
مزید پڑھیں Previous

South Korea GDP: On the path to recovery

Analysts at Australia and New Zealand Banking Group (ANZ) offer their afterthoughts on the South Korean GDP data release that outpaced expectations. K
مزید پڑھیں Next