Confirming you are not from the U.S. or the Philippines

یہ بیان دے کر، میں واضح طور پر یہ بتاتا اور تصدیق کرتا ہوں کہ:
  • میں امریکی شہری یا رہائشی نہیں ہوں
  • میں فلپائن کا رہائشی نہیں ہوں
  • میں بالواسطہ یا بلاواسطہ امریکی باشندوں کے 10 فیصد سے زیادہ شیئرز/ ووٹنگ کا حق/ امریکی باشندوں کے انٹرسٹ کا مالک نہیں ہوں اور/یا دوسرے ذرائع سے امریکی شہریوں یا رہائشیوں کو کنٹرول نہیں کرتا ہوں۔
  • میں بالواسطہ یا بلاواسطہ امریکی باشندوں کے 10 فیصد سے زیادہ شیئرز/ ووٹنگ کا حق/ انٹرسٹ کا مالک نہیں ہوں اور/ یا کسی دوسرے ذریعے سے امریکی شہری یا رہائشی کے کنٹرول میں نہیں ہوں۔
  • میں FATCA کے سیکشن (a)1504 کے معاملے میں امریکی شہریوں یا رہائشیوں کے ساتھ وابستہ نہیں ہوں
  • میں غلط اعلان کرنے پر اپنی ذمہ داری سے واقف ہوں۔
اس بیان کے مقاصد کے لئے، ریاستہائے متحدہ امریکہ کے تمام منحصر ممالک اور علاقوں کو امریکہ کے مرکزی علاقے کے برابر کردیا گیا ہے۔ میں اپنے اس بیان کی خلاف ورزی سے پیدا ہونے یا اس سے متعلق ہونے والے کسی بھی دعوے کے خلاف، بے ضرر آکٹا مارکیٹس انکارپوریٹڈ، اس کے ڈائریکٹرز اور افسران کا دفاع کرنے کا عہد کرتا ہوں۔
ہم آپ کی رازداری اور آپ کی ذاتی معلومات کے تحفظ کے لیے وقف ہیں۔ ہم محض اپنی پراڈکٹس اور سروسز کے متعلق خصوصی پیشکشوں اور اہم معلومات فراہم کرنے کے لیے ای میلز اکٹھا کرتے ہیں۔ اپنا ای میل ایڈریس دے کر، آپ ہم سے ایسے ای میلز وصول کرنے پر اتفاق کرتے ہیں۔ اگر آپ انسبسکرائب کرنا چاہتے ہیں یا کوئی سوالات یا خدشات ہوں تو، ہماری کسٹمر سپورٹ کو لکھیں۔
Octa trading broker
ٹریڈنگ اکاؤنٹ کھولیں
Back

EUR/JPY Price Analysis: Break of key support trendline, 100-day SMA signal further downside

  • EUR/JPY refreshes the monthly low on the break of key supports.
  • 50% Fibonacci retracement, November month low on the bears’ radar.
  • Buyers will stay away unless prices cross October high.

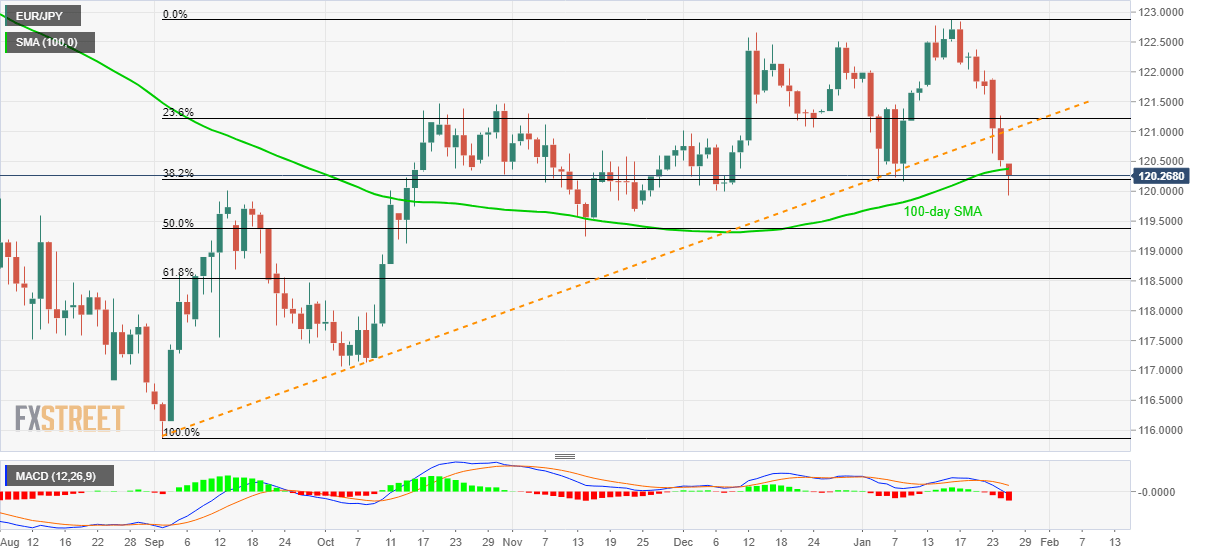
EUR/JPY trades near 120.30, following a fresh monthly low of 119.94 registered before few minutes, during the Asian session on Monday. The pair’s declines below an ascending trend line from early-September and 100-day SMA join bearish MACD to signal the pair’s further declines.

In doing so, 50% Fibonacci retracement of its upside from September 2019 to the current month high, around 119.35, coupled with November month low near 119.25, gain the sellers’ attention.

Should there be further weakness below 119.25, 61.8% Fibonacci retracement near 118.50 will become the bears’ favorite.

Meanwhile, pair’s daily closing above 100-day SMA level of 120.40 and the support-turned-resistance line of 121.00 will not be enough for the buyers’ recall as the October month high near 121.50 become the key resistance.

If the quote rallies beyond 121.50, its fresh run-up to 122.20 and 123.00 can’t be ruled out.

EUR/JPY daily chart
Trend: Bearish


Gold kick-starts the week with bullish gap-up to $1589 as coronavirus fuels risk aversion

Gold prices remain positive while taking rounds to $1,583, following the intra-day high of $1588.70 flashed at the week’s start, amid Monday’s Asian session.
مزید پڑھیں Previous

EUR/USD Price Analysis: MACD offers strongest bearish signal since mid-November

EUR/USD has dropped from 1.1240 to 1.1020 over the last four weeks and may continue to exhibit pressure behavior this week as the MACD histogram is re
مزید پڑھیں Next