Confirming you are not from the U.S. or the Philippines

یہ بیان دے کر، میں واضح طور پر یہ بتاتا اور تصدیق کرتا ہوں کہ:
  • میں امریکی شہری یا رہائشی نہیں ہوں
  • میں فلپائن کا رہائشی نہیں ہوں
  • میں بالواسطہ یا بلاواسطہ امریکی باشندوں کے 10 فیصد سے زیادہ شیئرز/ ووٹنگ کا حق/ امریکی باشندوں کے انٹرسٹ کا مالک نہیں ہوں اور/یا دوسرے ذرائع سے امریکی شہریوں یا رہائشیوں کو کنٹرول نہیں کرتا ہوں۔
  • میں بالواسطہ یا بلاواسطہ امریکی باشندوں کے 10 فیصد سے زیادہ شیئرز/ ووٹنگ کا حق/ انٹرسٹ کا مالک نہیں ہوں اور/ یا کسی دوسرے ذریعے سے امریکی شہری یا رہائشی کے کنٹرول میں نہیں ہوں۔
  • میں FATCA کے سیکشن (a)1504 کے معاملے میں امریکی شہریوں یا رہائشیوں کے ساتھ وابستہ نہیں ہوں
  • میں غلط اعلان کرنے پر اپنی ذمہ داری سے واقف ہوں۔
اس بیان کے مقاصد کے لئے، ریاستہائے متحدہ امریکہ کے تمام منحصر ممالک اور علاقوں کو امریکہ کے مرکزی علاقے کے برابر کردیا گیا ہے۔ میں اپنے اس بیان کی خلاف ورزی سے پیدا ہونے یا اس سے متعلق ہونے والے کسی بھی دعوے کے خلاف، بے ضرر آکٹا مارکیٹس انکارپوریٹڈ، اس کے ڈائریکٹرز اور افسران کا دفاع کرنے کا عہد کرتا ہوں۔
ہم آپ کی رازداری اور آپ کی ذاتی معلومات کے تحفظ کے لیے وقف ہیں۔ ہم محض اپنی پراڈکٹس اور سروسز کے متعلق خصوصی پیشکشوں اور اہم معلومات فراہم کرنے کے لیے ای میلز اکٹھا کرتے ہیں۔ اپنا ای میل ایڈریس دے کر، آپ ہم سے ایسے ای میلز وصول کرنے پر اتفاق کرتے ہیں۔ اگر آپ انسبسکرائب کرنا چاہتے ہیں یا کوئی سوالات یا خدشات ہوں تو، ہماری کسٹمر سپورٹ کو لکھیں۔
Octa trading broker
ٹریڈنگ اکاؤنٹ کھولیں
Back

USD/CHF Price Analysis: Bulls aim for 200-week SMA as MACD turns strongest in nine weeks

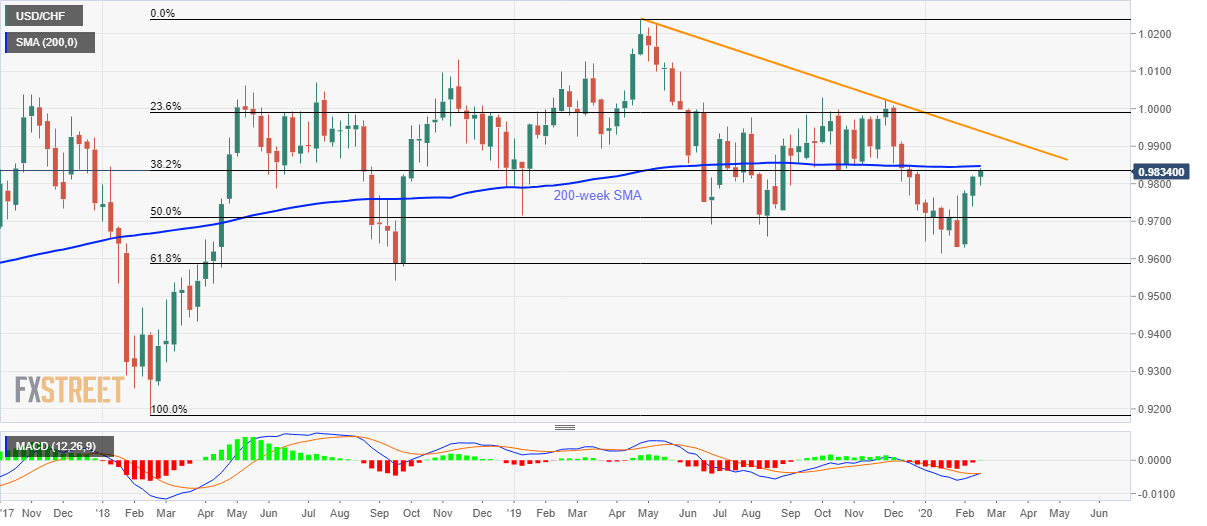
  • USD/CHF registers three-week winning streak, breaks above 38.2% Fibonacci retracement for the first time in a year.
  • 61.8% Fibonacci retracement, September 2018 low act as the key supports.

USD/CHF takes the bids to 0.9835 amid the pre-European session on Wednesday. In doing so, the pair crosses 38.2% Fibonacci retracement of its broad run-up between February 2018 and April 2019. Also supporting the pair’s upside is a first in nine weeks bullish MACD signal.

Based on that, buyers are again targeting a 200-week SMA level of 0.9850 whereas a descending trend line from April 2019, at 0.9940 can question the bulls afterward.

In a case where the USD/CHF prices stay strong beyond 0.9940, chances of witnessing the 1.0000 mark on the chart can’t be ruled out.

Alternatively, 0.9770/65 and 50% Fibonacci retracement level around 0.9710 can entertain sellers during the pullback ahead of pleasing them with the yearly bottom of 0.9612.

However, 61.8% Fibonacci retracement and September 2018 trough near 0.9585 and 0.9540 respectively could challenge the bears during the further declines.

USD/CHF weekly chart
Trend: Bullish


China dumps US Treasuries for the sixth straight month in December

According to the US Treasury Department report released Tuesday, China’s total shrank $54.4 billion on the year to $1.07 trillion. China sold around $
مزید پڑھیں Previous

USD/JPY Price Analysis: Rises above 110, but bull breakout still elusive

The bid tone around the anti-risk Japanese yen weakened, allowing USD/JPY to rise to 110.11, as the futures on the S&P 500 ticked higher hinting at ri
مزید پڑھیں Next