Gold Price Analysis: Slips below weekly support trendline, but still above $1,700
- Gold snaps two-day winning streak, registers mild losses following the support line break.
- 200-HMA on the sellers’ radars ahead of $1,700 round-figures.
- Immediate falling trend line from the weekly top guards the recovery moves.
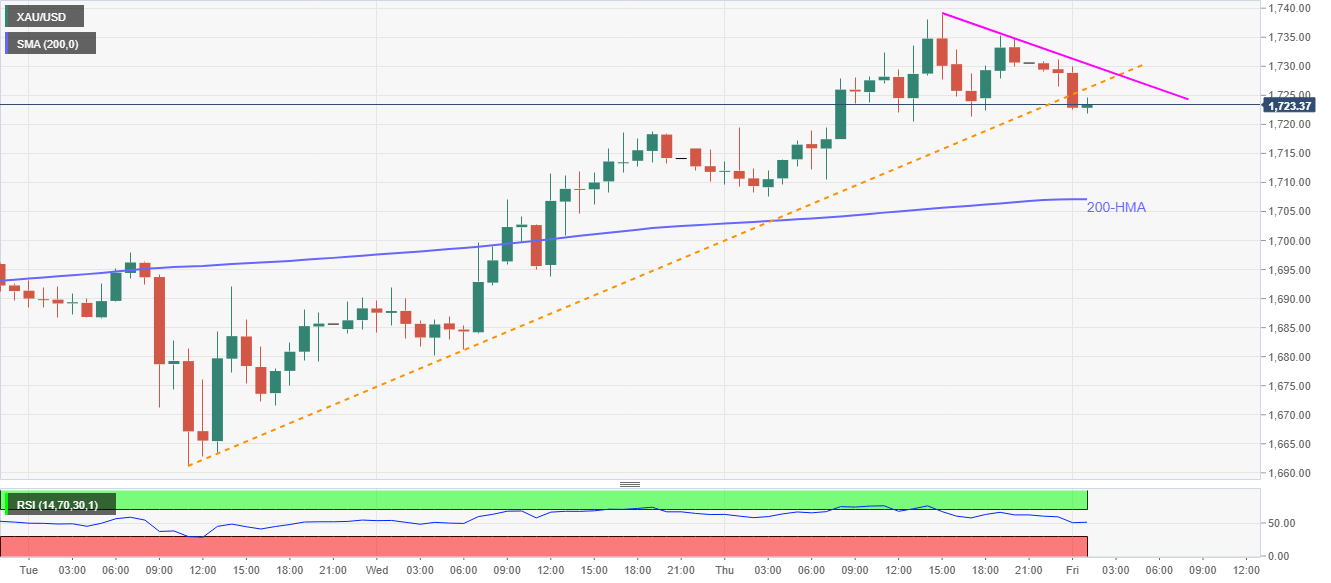
Gold prices drop to $1,722.80, down 0.45% on a day, during the Asian session on Friday. The bullion recently broke the weekly rising support line, now resistance.
As a result, sellers can aim for a 200-HMA level of $1,707 if they manage to dominate below Wednesday’s top surrounding $1,718.75.
In a case where the precious metal remains weak under 200-HMA, $1,700 and $1,698/97 can entertain the bears ahead of recalling the weekly bottom near $1,661.
Alternatively, an immediate falling trend line from Thursday’s top, at $1,730.50 now, may question the recovery moves beyond the support-turned-resistance line of $1,726.
If at all bulls manage to keep the helm beyond $1,730.50, odds of them refreshing the seven-year high above $1,748 can’t be ruled out.
Gold hourly chart
Trend: Pullback expected