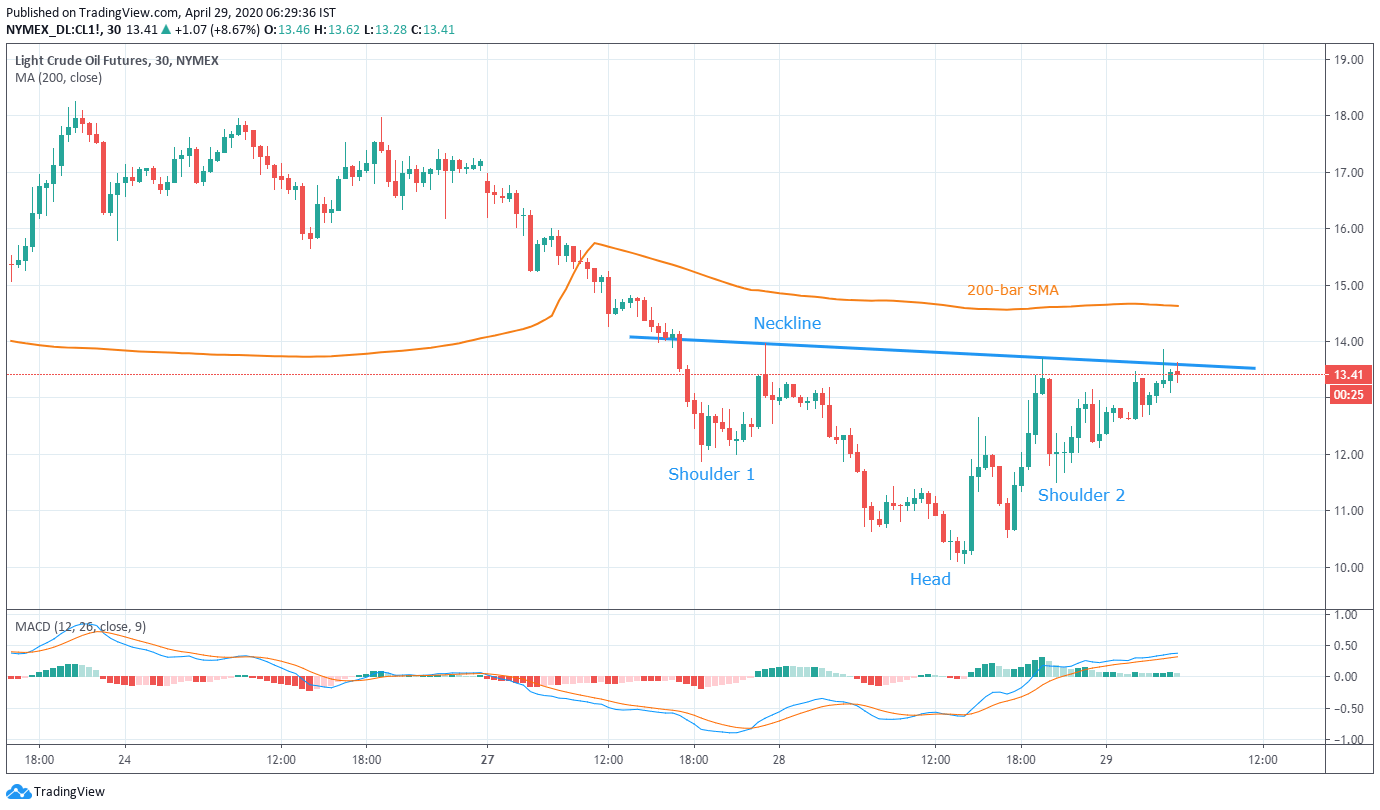
WTI Price Analysis: Teases inverse Head-and-Shoulders above $13.00
- WTI nears the confirmation of a bullish technical pattern.
- 200-bar SMA adds to the upside filters.
- $10.00 holds the key to further downside.
WTI June futures on NYMEX extends the post-API data recovery moves to $13.40, up 8.50% on a day, amid the Asian trading session on Wednesday.
In doing so, the black gold teases the neckline of an inverse Head-and-Shoulders bullish technical formation that gets confirmed on the successful break above $13.65.
Should that happen, which bears increasing odds due to the bullish MACD, $15.60/65 can offer an intermediate halt to the energy benchmark’s rise to pierce $17.00.
It’s worth mentioning that the 200-bar SMA near $14.65 adds to the upside filters after the bullish formation’s confirmation.
On the contrary, the quote’s pullback moves can take rest near $12.00 while a further downside may aim for Tuesday’s low near $10.00.
If at all the oil price declines below $10.00, the previous week’s low near $6.50 will return to the charts.
WTI 30-minute chart
Trend: Further recovery expected