Confirming you are not from the U.S. or the Philippines

یہ بیان دے کر، میں واضح طور پر یہ بتاتا اور تصدیق کرتا ہوں کہ:
  • میں امریکی شہری یا رہائشی نہیں ہوں
  • میں فلپائن کا رہائشی نہیں ہوں
  • میں بالواسطہ یا بلاواسطہ امریکی باشندوں کے 10 فیصد سے زیادہ شیئرز/ ووٹنگ کا حق/ امریکی باشندوں کے انٹرسٹ کا مالک نہیں ہوں اور/یا دوسرے ذرائع سے امریکی شہریوں یا رہائشیوں کو کنٹرول نہیں کرتا ہوں۔
  • میں بالواسطہ یا بلاواسطہ امریکی باشندوں کے 10 فیصد سے زیادہ شیئرز/ ووٹنگ کا حق/ انٹرسٹ کا مالک نہیں ہوں اور/ یا کسی دوسرے ذریعے سے امریکی شہری یا رہائشی کے کنٹرول میں نہیں ہوں۔
  • میں FATCA کے سیکشن (a)1504 کے معاملے میں امریکی شہریوں یا رہائشیوں کے ساتھ وابستہ نہیں ہوں
  • میں غلط اعلان کرنے پر اپنی ذمہ داری سے واقف ہوں۔
اس بیان کے مقاصد کے لئے، ریاستہائے متحدہ امریکہ کے تمام منحصر ممالک اور علاقوں کو امریکہ کے مرکزی علاقے کے برابر کردیا گیا ہے۔ میں اپنے اس بیان کی خلاف ورزی سے پیدا ہونے یا اس سے متعلق ہونے والے کسی بھی دعوے کے خلاف، بے ضرر آکٹا مارکیٹس انکارپوریٹڈ، اس کے ڈائریکٹرز اور افسران کا دفاع کرنے کا عہد کرتا ہوں۔
ہم آپ کی رازداری اور آپ کی ذاتی معلومات کے تحفظ کے لیے وقف ہیں۔ ہم محض اپنی پراڈکٹس اور سروسز کے متعلق خصوصی پیشکشوں اور اہم معلومات فراہم کرنے کے لیے ای میلز اکٹھا کرتے ہیں۔ اپنا ای میل ایڈریس دے کر، آپ ہم سے ایسے ای میلز وصول کرنے پر اتفاق کرتے ہیں۔ اگر آپ انسبسکرائب کرنا چاہتے ہیں یا کوئی سوالات یا خدشات ہوں تو، ہماری کسٹمر سپورٹ کو لکھیں۔
Back

USD/JPY pushes lower as safe haven demand grows

  • USD/JPY trades 0.62% lower on Tuesday as safe-haven demand grows in the FX markets.
  • The price has temporarily stalled at a trendline seen on the 4-hour chart.

USD/JPY 4-hour chart

Currencies like JPY and CHF have strengthened on Tuesday as the demand for safe-haven currencies grows. It has been said by some analysts that the issues between North Korea and South Korea kicked off the demand as other Asian nations piled into the Yen. The USD/JPY pair normally correlates to the stock markets but this time there is a serious divergence as the US equities indices are still on the rise.

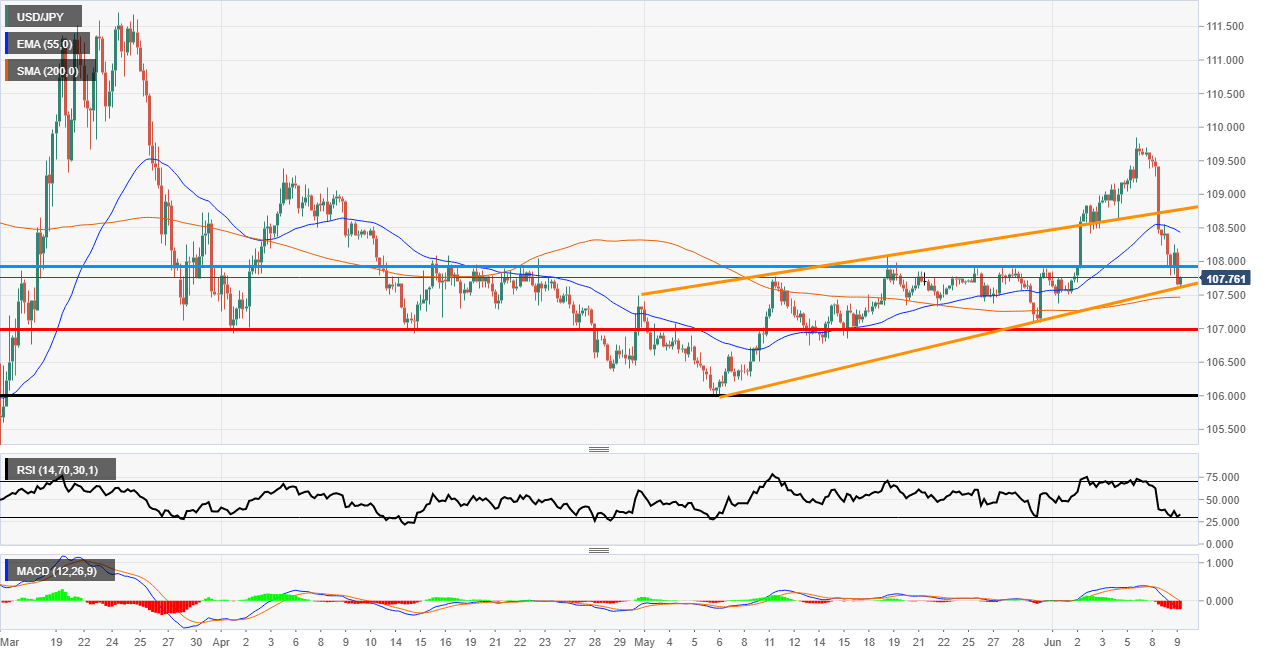
The chart below shows the bears stepped in before the market had a chance to test the 110.00 psychological level. Since then the price has pushed back below the 55 Exponential Moving Average (EMA) and the pair has just broken below the 108.00 handle. 

There has been some support at a trendline (marked in orange on the chart below) but this could be short-lived. Below that, there is the 200 Simple Moving Average (SMA) and the red support level very close but just above 107.00.  The daily 55 EMA and 200 SMA's are both broken to the downside which further compounds the pairs woes.

The indicators are looking pretty bearish as the Relative Strength Index is in the oversold area and the MACD histogram is red. The MACD signal lines have also dipped below the zero line which is also indicating more bearishness is on the way. 

USD/JPY Safe haven demand

Additional levels


S&P 500 stages technical correction, bullish outlook remains intact

The S&P 500 Index (SPX) gained more than 1% and touched its highest level since late February at 3,233 points. With investors looking to book their pr
مزید پڑھیں Previous

USD/MXN Price Analysis: Mexican peso in a consolidation range, under 22.00

The USD/MXN pair printed a fresh two month lows on Tuesday at 21.45 and then rebounded. Again the area around 21.45/50 capped the downside and trigger
مزید پڑھیں Next