Gold Price Analysis: XAU/USD fails to appreciate break of weekly support line
- Gold prices form a short-term symmetrical triangle while extending pullback from Friday’s high.
- 200-HMA adds to the downside support, buyers will have to refresh monthly high for fresh strength.
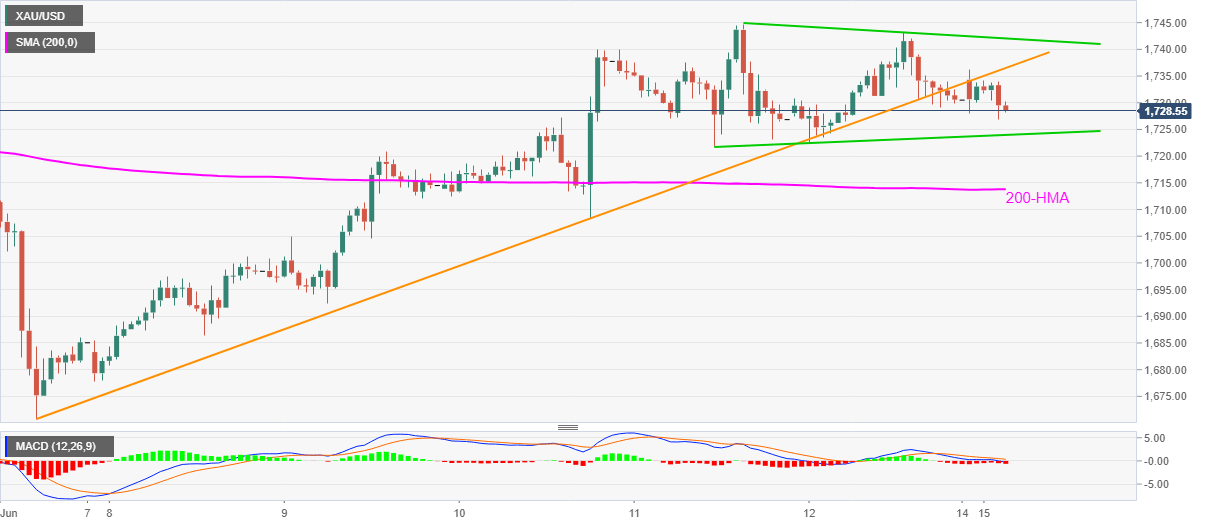
Gold prices decline to $1,728.60, down 0.12% on a day, during the early Monday’s trading. The bullion recently slipped below an ascending trend line from June 05 but a two-day-old symmetrical triangle restricts the metal’s immediate moves amid bearish MACD. However, the safe-haven’s repeated failures to cross $1,745 during the current month keeps the sellers hopeful.
Hence, the said triangle’s support around $1,724 acts as the trigger for the commodity’s further fall towards a 200-HMA level of $1,713.75.
Though, the bears’ dominance below 200-HMA can easily probe $1,700 round-figure with the monthly low near $1,675 acting as the following level to watch.
Meanwhile, the support-turned-resistance line near $1,736 guards the bullion’s immediate upside, break of which could challenge the symmetrical triangle’s upper line, at $1,742 now.
In a case where the buyers manage to cross $1,742, they need validation from the sustained break beyond $1,745 to challenge the May month high of $1,765.38.
Gold hourly chart
Trend: Sideways