

S&P 500 Futures: Battle lines well-defined ahead of US data – Confluence Detector
With the risk-on sentiment back in vogue amid optimism over more stimulus and coronavirus cure, the S&P 500 futures broke the Asian consolidation phase to the upside and rallied 0.80% to regain the 3,350 level.
The bulls gear up for a test of the all-time-highs reached in early February at 3,397.50. Although uncertainty over the US fiscal stimulus and economic recovery could keep the further upside elusive. Let’s take a look at how its positioned technically.
S&P 500 Futures: Key resistances and supports
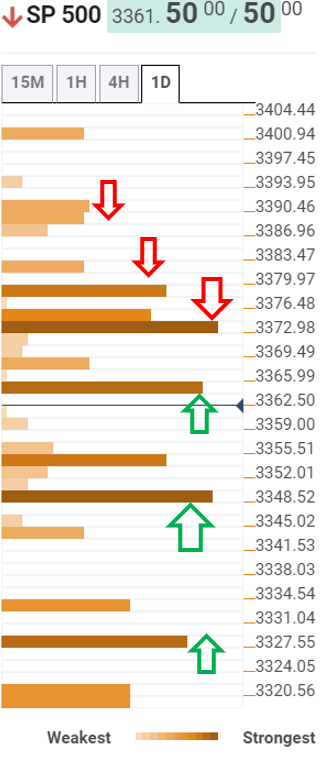
The tool shows that the S&P 500 futures flirt with 3,363 levels, which is the convergence of the previous day low and previous high on four-hour.
The next relevant resistance is aligned 3,372, the intersection of the Pivot Point one-week R1, Bollinger Band one-day Upper and SMA10 one-hour.
Acceptance above the latter will call for a test of the Fibonacci 38.2% one-day at 3,380 en route the previous day high near 3,387. The buyers will then aim for the record highs.
Alternatively, 3,355 is the immediate cushion for the bulls, where the previous week high and pivot point one-day S2 meet.
Further south, powerful support at 3,348 will test the bears’ commitment. The level is the confluence of the Fib 161.8% one-day, SMA5 one-day and Bollinger Band four-hour Middle.
A sharp sell-off could be triggered below a break of the latter, which could put 3,327 support at risk, the pivot point one-month R1.
S&P 500 Futures: Chart
About the Confluence Detector
The TCI (Technical Confluences Indicator) is a tool to locate and point out those price levels where there is a congestion of indicators, moving averages, Fibonacci levels, Pivot Points, etc. Knowing where these congestion points are located is very useful for the trader, and can be used as a basis for different strategies.
Learn more about Technical Confluence