USD/JPY Price Analysis: Breaks below a rising wedge, further downside ahead
- The USD/JPY break below the rising wedge might open the door for additional losses.
- USD/JPY Price Analysis: A break below 138.00 could send the pair towards 133.21, just below the rising wedge’s target.
The USD/JPY snaps two consecutive days of losses and remains subdued, recording a minimal gain of 0.05%, amidst an upbeat market mood after investors shrugged off recession fears, as US companies reported earnings, which had shown some resilience, even though the Federal Reserve is hiking rates aggressively. At the time of writing, the USD/JPY is trading at 138.16.
USD/JPY Price Analysis: Technical outlook
The USD/JPY Tuesday’s price action witnessed the pair opening near the highs of the day at 138.12 but tumbled as risk appetite shifted sour towards the 200-hour EMA at 137.51, which also intersected around that area with the S2 pivot point. The major bounced off those lows and rose to the daily pivot point at 138.20.
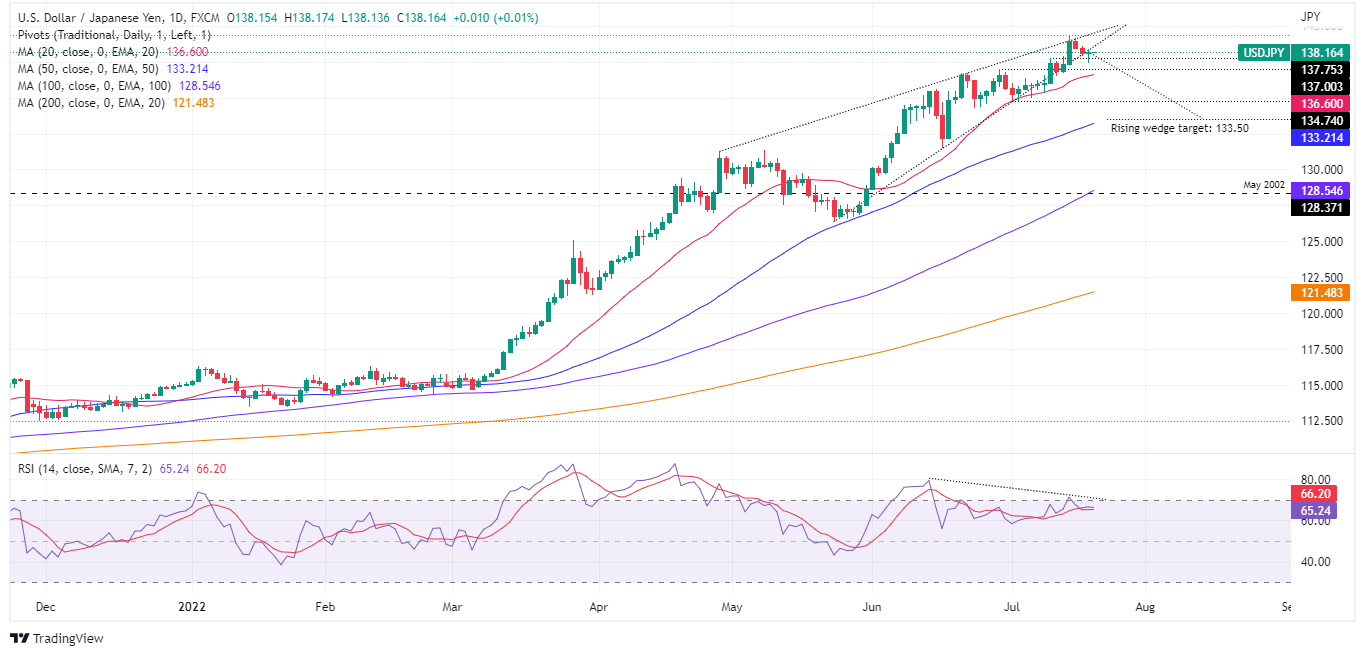
USD/JPY Daily chart
From a technical perspective, the USD/JPY is upward biased, but a break below the rising wedge, achieved on Tuesday, might open the door for further downside. USD/JPY traders should be aware that the Relative Strength Index (RSI) exited from overbought conditions and is in bullish territory but crossed below the RSI’s 7-day SMA, meaning it has a bearish reading.
If the USD/JPY accelerates downwards and sellers break the 138.00 figure, that would open the door for further losses. That said, the USD/JPY first support would be the 20-day EMA at 136.60. Break below will send the pair sliding to the July 1 low at 134.74, followed by the 50-day EMA at 133.21.
USD/JPY Traders Sentiment